
Related questions
HELP ASAP. info is given in the pic.
Use the following scenario and data when answering questions 36) -> 38):
Fred G. Hire is the manager of human resources at Crescent Tool and Die, Inc. As part of
his yearly report to the CEO, he is required to present an analysis of the salaried
employees. Because there are over 1,000 employees, he does not have the staff to gather
information on each salaried employed, so he selects a random sample of 30 (Fred G. Hire
worksheet). For each employee, he records monthly salary; service at Crescent, in
months; gender (1 = male, 0 = female); and whether the employee has a technical or
clerical job. Those working technical jobs are coded 1 and those who are clerical 0.
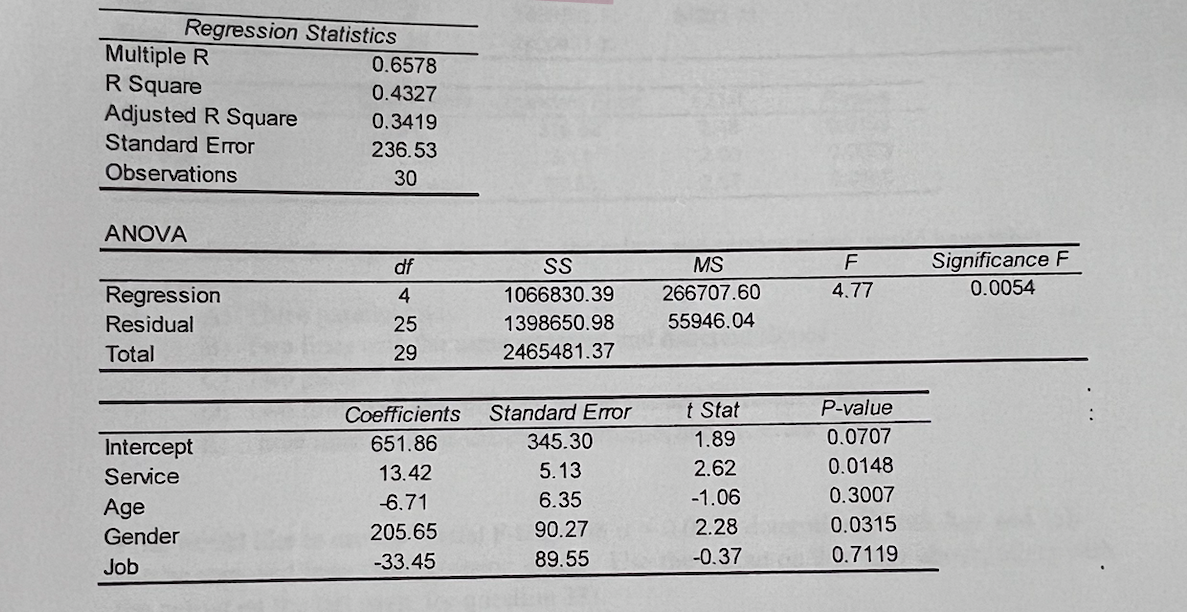
Fred uses excel to fit a multiple regression model using salary as the dependent or Y
variable and the other four variables as independent or X variables. The output appears
below. Use this output for question 36) below.
36) The regression model above suggests that for two employees (one male and one
female) who both have 10 years of service, work technical jobs, and are the same age:
A) The male employee makes $651.86 more than the female employee.
B) The male employee makes $205.65 more than the female employee
C) The model predicts the same salary for both employees.
D) The female employee makes $205.65 more than the male employee
E) The female employee makes $651.86 more than the male employee.
As part of this analysis Fred uses excel to fit a multiple regression model using salary as
the dependent or Y variable and Service and Gender as independent or X variables. The
output appears below. Use this output for question 37).
37) A sketch of the regression model in the salary and service plane would have what
structure
A) Three parallel lines
B) Two lines with the same intercept and different slopes
C) Two parallel lines
D) Two lines with the different intercepts and different slopes
E) Three lines with the different intercepts and different slopes
Fred would like to use the Partial F-test with a = 0.05 to determine if both Age and Job
can be removed from the regression model. Use the output on this page above, along with
the output on the last page, for question 38).
38) What is the value of Fo, the test statistic of the Partial F-test.
A) 1.65
B) 9.19
C) 0.61
D) 4.77
E) 2.27


Trending nowThis is a popular solution!

Step by stepSolved in 3 steps


- 5. Identify each of the following examples as attribute (qualitative) or numerical (quantitative) variables. a) The residence hall for each student in a statistics class. b) The amount of gasoline pumped by the next 10 customers at the local Unimart. c) The amount of radon in the basement of each of 25 homes in a new development. d) The colour of the baseball cap worn by each of 20 students. e) The length of time to complete a mathematics homework assignment. f) The temperature in Accra, Ghana at 12:00 pm on any given day. g) The make of automobile driven by each faculty member. h) Whether a 6 volts lantern battery is defective. i) The weight of a lead pencil. j) The brand of cereal children eat for breakfast. k) The type of book taken out of the library by an adult.arrow_forwardclassify as either observational or experimental designCase 1: Starting Salaries. The National Association of Colleges and Employers (NACE) compiles information on salary offers to new college graduates and publishes the results in Salary Survey.arrow_forwardWould you like a cup of tea? Carole and Julius are getting ready to open a new cafe and are gathering up information about sales of different drinks in their state. They obtain data containing the yearly sales (in $1000s) for three types of tea: Darjeeling, Earl Grey, and Green Tea. A boxplot of the data and a histogram of the sales for all three teas combined is shown below. Note: Clicking on any image in this problem will open it in a new window, allowing you to enlarge the view. Tea Sales by Product Combined Tea Sales Darjeeling Earl Grey Green Tea 100 200 300 400 Product Sales in $1000 Part 1: Use the plots above to make quantitative comparisons and answer the following questions: Quantity A: The 75th percentile (Q3) of Sales for Darjeeling Tea Quantity B: The 75th percentile (Q3) of Sales for Green Tea Quantity A is greater 008 007 Frequency 00z 001 Sales in $1000arrow_forward
- Whiat would be a easy suitable research design for this topic. Topic: The impact of unemployment on mental health in Anguilla.arrow_forwardFor the three-part question that follows, provide your answer to each question in the given workspace. Identify each part with a coordinating response. Be sure to clearly label each part of your response as Part A, Part B, and Part C.Part A: What is the term for a generalization made about a population using the data from a sample?Part B: Name one challenge that may occur when using a sample to draw a conclusion about a population.Part C: A researcher collects data about the annual salary of employees who work in the information technology field. It would be difficult to survey all employees, so a sample of the population is surveyed. The data is recorded below. Use the table to write one conclusion that can be drawn. Explain why this conclusion is valid. Salary Range (Per Year) Number of Employees $50,000-$59,999 147 $60,000-$69,999 159 $70,000-$79,999 225 $80,000-$89,999 27arrow_forwardWould you like a cup of tea? Carole and Julius are getting ready to open a new cafe and are gathering up information about sales of different drinks in their state. They obtain data containing the yearly sales (in $1000s) for three types of tea: Darjeeling, Earl Grey, and Green Tea. A boxplot of the data and a histogram of the sales for all three teas combined is shown below. Note: Clicking on any image in this problem will open it in a new window, allowing you to enlarge the view. Tea Sales by Product Combined Tea Sales Darjeeling Earl Grey Green Tea 100 200 300 400 Product Sales in $1000 Part 1: Use the plots above to make quantitative comparisons and answer the following questions: Quantity A: The 75th percentile (Q3) of Sales for Darjeeling Tea Quantity B: The 75th percentile (Q3) of Sales for Green Tea Quantity A is greater Quantity A: The median of Sales for Darjeeling Tea Quantity B: The median of Sales for Green Tea Quantity B is greater 00€ 007 Frequency > 000 008 007 Sales in…arrow_forward
- To the Internal Revenue Service (IRS), the reasonableness of total itemized deductions depends on the taxpayer's adjusted gross income. Large deductions, which include charity and medical deductions, are more reasonable for taxpayers with larg given level of income, the chances of an IRS audit are increased. Data (in thousands of dollars) on adjusted gross income and the average or reasonable amount of itemized deductions follow. Adjusted Gross Income Itemized Deductions ($1,000s) 22 ($1,000) 9.6 27 9.6 32 10.1 48 11.1 65 13.5 85 120 15.7 25.5 (a) Develop a scatter diagram for these data with adjusted gross income as the independent variable. 30 25 20 15 10 5 30 25 20 15 10 5+ 30 25- 20- 15- 10- .. 5- 0 20 40 60 80 100 120 140 Adjusted Gross Income ($1,000s) 0 20 40 60 80 100 120 140 0 Adjusted Gross Income ($1,000s) 20 40 60 80 100 120 140 Adjusted Gross Income ($1,000s) 30 25 20 15 10 5- 0 20 40 60 80 100 Adjusted Gross Income ($1,000s) 120 140 G (b) Use the least squares method to…arrow_forwardThe forecasts generated by two forecasting methods and actual sales have been collected in the Microsoft Excel Online file attached. Use the Microsoft Excel Online file attached to develop forecast accuracy and answer the following questions. 1. What is the MAD, the MSE, the MAPE, the RSFE, and the tracking signal for each forecasting method? Do not round intermediate calculations. Round your answers to two decimal places. Use the minus sign to enter negative values, if any. 2. What can be concluded about the quality of the forecasts 2? Assume that the control limit for the tracking signal is ±3. The results indicate (bias or no bias) in the forecasts 2, and that the tracking signal (is not or is) within the control limits of ±3.arrow_forwardTo the Internal Revenue Service (IRS), the reasonableness of total itemized deductions depends on the taxpayer's adjusted gross income. Large deductions, which include charity and medical deductions, are more reasonable for taxpayers with large adjusted gross incomes. If a taxpayer claims larger th average itemized deductions for a given level of income, the chances of an IRS audit are increased. Data (in thousands of dollars) on adjusted gross income and the average or reasonable amount of itemized deductions follow. Adjusted Gross Income ($1,000s) 22 Itemized Deductions ($1,000s) 9.6 27 9.6 32 10.1 48 11.1 65 11.5 85 120 19.7 23.5 (a) Develop a scatter diagram for these data with adjusted gross income as the independent variable. 30 25 20 15 • 10 5 Itemized Deductions ($1,000s) 0 20 40 60 80 100 120 Adjusted Gross Income ($1,000s) 140 30 25 20 15 10 5. Itemized Deductions ($1,000s) 30 25 20 15 10 • 15 • 10 5- 0 20 40 60 80 100 120 140 0 Adjusted Gross Income ($1,000s) 20 40 60 80 100…arrow_forward
- See pictures for graphics. Problem: Methadone is a synthetic drug whose effect on the body is similar to that of morphine and heroin. Methadone has been used to help people control their addictions to these other drugs. Recently, the governor of Florida vetoed a million-dollar appropriation for several Methadone clinics in the state. Had Methadone use gotten out of hand? The following is a histogram that summarizes information from a study of 25 Florida Methadone clinic patients. (Florida's projected mean daily dosage per Methadone clinic patient was about 100 milligrams.)arrow_forwardThe International League of Triple-A minor league baseball consists of 14 teams organized into three divisions: North, South, and West. The data showing the average attendance for the 14 teams in the International League are contained in the Excel Online file below. Also shown are the teams’ records; W denotes the number of games won, L denotes the number of games lost, and PCT is the proportion of games played that were won. Construct a spreadsheet to answer the following questions. Team Name Division W L PCT Attendance Buffalo Bisons North 66 77 0.462 8791 Lehigh Valley IronPigs North 55 89 0.382 8454 Pawtucket Red Sox North 85 58 0.594 9080 Rochester Red Wings North 79 70 0.53 6909 Scranton-Wilkes Barre Yankees North 88 56 0.611 7164 Syracuse Chiefs North 69 77 0.473 5749 Charlotte Knights South 68 78 0.466 4545 Durham Bulls South 74 70 0.514 7020 Norfolk Tides South 64 78 0.451 6269 Richmond Braves South 63 79 0.444 4449 Columbus Clippers West 69 73 0.486…arrow_forwardPlease help by providing detailed workings. Answers to a minimum of 6 d.p. Thanksarrow_forward
- MATLAB: An Introduction with ApplicationsStatisticsISBN:9781119256830Author:Amos GilatPublisher:John Wiley & Sons Inc
 Probability and Statistics for Engineering and th...StatisticsISBN:9781305251809Author:Jay L. DevorePublisher:Cengage Learning
 Statistics for The Behavioral Sciences (MindTap C...StatisticsISBN:9781305504912Author:Frederick J Gravetter, Larry B. WallnauPublisher:Cengage Learning
  Elementary Statistics: Picturing the World (7th E...StatisticsISBN:9780134683416Author:Ron Larson, Betsy FarberPublisher:PEARSON
 The Basic Practice of StatisticsStatisticsISBN:9781319042578Author:David S. Moore, William I. Notz, Michael A. FlignerPublisher:W. H. Freeman
 Introduction to the Practice of StatisticsStatisticsISBN:9781319013387Author:David S. Moore, George P. McCabe, Bruce A. CraigPublisher:W. H. Freeman