Given are five observations for two variables, x and y. 15 14 16 19 Yi 56 55 48 17 13 The estimated regression equation for these data is ŷ = 63.98 –- 2.38a. a. Compute SSE, SST, and SSR. SSE (to 2 decimals) SST (to 2 decimals) SSR (to 2 decimals) b. Compute the coefficient of determination p2. Comment on the goodness of fit. (to 3 decimals) The least squares line provided an Select your answer - fit; % of the variability in y has been explained by the estimated regression equation (to 1 decimal). c. Compute the sample correlation coefficient. Enter negative value as negative number. (to 3 decimals)
Given are five observations for two variables, x and y. 15 14 16 19 Yi 56 55 48 17 13 The estimated regression equation for these data is ŷ = 63.98 –- 2.38a. a. Compute SSE, SST, and SSR. SSE (to 2 decimals) SST (to 2 decimals) SSR (to 2 decimals) b. Compute the coefficient of determination p2. Comment on the goodness of fit. (to 3 decimals) The least squares line provided an Select your answer - fit; % of the variability in y has been explained by the estimated regression equation (to 1 decimal). c. Compute the sample correlation coefficient. Enter negative value as negative number. (to 3 decimals)

Functions and Change: A Modeling Approach to College Algebra (MindTap Course List)
6th Edition
ISBN:9781337111348
Author:Bruce Crauder, Benny Evans, Alan Noell
Publisher:Bruce Crauder, Benny Evans, Alan Noell
Chapter5: A Survey Of Other Common Functions
Section5.6: Higher-degree Polynomials And Rational Functions
Problem 1TU: The following fictitious table shows kryptonite price, in dollar per gram, t years after 2006. t=...

Related questions
Question
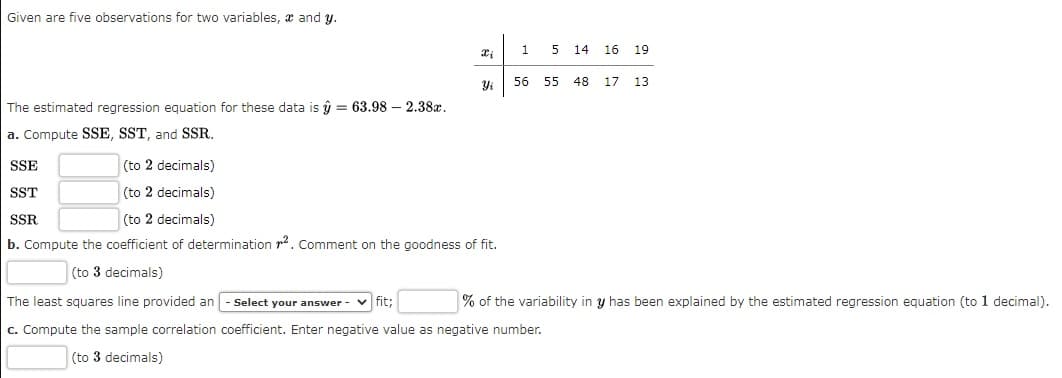
Transcribed Image Text:Given are five observations for two variables, a and y.
1
5 14 16 19
56 55 48 17 13
The estimated regression equation for these data is ŷ = 63.98 – 2.38x.
a. Compute SSE, SST, and SSR,
SSE
(to 2 decimals)
SST
(to 2 decimals)
SSR
(to 2 decimals)
b. Compute the coefficient of determination p2. Comment on the goodness of fit.
(to 3 decimals)
The least squares line provided an - Select your answer - v fit;
% of the variability in y has been explained by the estimated regression equation (to 1 decimal).
c. Compute the sample correlation coefficient. Enter negative value as negative number.
(to 3 decimals)
Expert Solution
This question has been solved!
Explore an expertly crafted, step-by-step solution for a thorough understanding of key concepts.

This is a popular solution!

Trending now
This is a popular solution!

Step by step
Solved in 3 steps with 1 images

Recommended textbooks for you
Functions and Change: A Modeling Approach to Coll…
Algebra
ISBN:
9781337111348
Author:
Bruce Crauder, Benny Evans, Alan Noell
Publisher:
Cengage Learning
Functions and Change: A Modeling Approach to Coll…
Algebra
ISBN:
9781337111348
Author:
Bruce Crauder, Benny Evans, Alan Noell
Publisher:
Cengage Learning