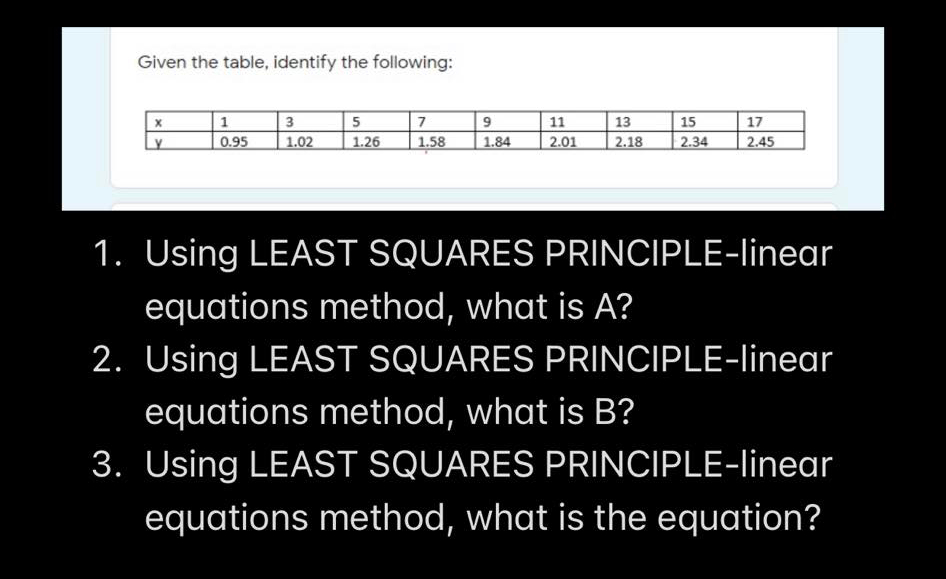
Given the table, identify the following: 3 5 11 13 15 17 0.95 1.02 1.26 1.58 1.84 2.01 2.18 2.34 2.45
Q: Using the given data, find the following. 5 24 20 18 21 11
A: The ascending order of the given data is given below:5, 11, 18, 20, 21, 24
Q: After giving a statistics exam, Professor Dang detemmined the following five-number summary for her…
A: Five number summary is a nice way to represent data It includes minimum, first quartile Q1, Second…
Q: In the first term, Sam's courses and grades were as follows: Calculate Sam Grade Point Average…
A: Introduction: Credits attempted - This is the total number of credits you've attempted for the…
Q: Find the Range from the following data series. 256, 258, 225, 296, 284, 276, 226, 235, 297, 257 O a…
A: According to the given information, we have Data set: 256, 258, 225, 296, 284, 276, 226, 235, 297,…
Q: Determine the median of the following set of values. Round to the nearest tenth when applicable. 61…
A: Given,61, 78 , 92 , 43 , 55 ,90Arrange the given data in Ascending order43 , 55 , 61 , 78 , 90 , 92
Q: Draw a bar chart for the following data showing the percentage of total population in villages and…
A:
Q: Find the Missing figure in the following data : Year 1950 1955 1960 1965 1970 Sales of Cloth 250 285…
A: Introduction We have to find out the missing data in the given table. This question is related to…
Q: Select the appropriate answer for the following diagram. 56 42 on 474.11 686.33 559.00 771 22 346.78…
A:
Q: Draw a subdivided and percentage subdivided bar diagram for the following data year Public companies…
A: Given
Q: Given the total number of the labor force, complete the following Table by calculating the total…
A: Provided data is; Year Total labor force Total employed Unemployed rate 2016 8372 8162.7…
Q: Use the data below to answer the following questions: Person Before Competition After Competition…
A: Formula : Standard error : Se = Sd/√n
Q: Find the IQR for the following data values: 375, 210, 150, 147, 429, 389, 580, 507, 180. a.…
A: Interquartile range is given by : IQR = Q3 - Q1
Q: The following ten data values are provided: 3815 3083 1609 1566 1430 1428 1299 995 973 820 The value…
A: Quartile : First quartile is the value such that 25% data fall below that value.
Q: Ms. Edwards counted the different types of plants in her garden. Refative Frequency Plants Frequency…
A: Given some frequency data, we have to find the relative frequencies and percentage of frequencies.
Q: Use the currency exchange rates in the table for the following question. Currency British pound…
A: Currency exchange rates are applied to convert dollar to foreign currency.
Q: Given the following data, find y'(6) 3 4 9 y 4 26 58 112 466 922
A: Interpolate the data using Lagrange's interpolation polynomial. After that differentiate the…
Q: Find the mean for this list of numbers 14 57 47 92 82 89 68 59 17 62 49 4 90 26 Mean= Submit…
A:
Q: Use the currency exchange rates in the table for the following question. Currency British pound…
A:
Q: 5. Draw a bar chart for the following data showing the percentage of total population in villages…
A:
Q: The annual amount of rainfall for 25 cities was recorded and is shown in the histogram below. Annual…
A: Step (I)Given Hirtogram belowAnnual rainfall(in)Find intervals could represent on annual rainfallof…
Q: Cite any relevant observation/s from the diagram below. 80.5 84.0 87.5 91.0 94.5 98.0 Acetone…
A: Given diagram It is a dot plot for Acetone concentration
Q: Based on the histogram above, what is the frequency of the class containing the value 14
A:
Q: 1. Construct a pie chart for the following infor Type of Frequene Car BMW y 15 Relative Percent…
A:
Q: Find the 5 number summary for the data shown 3. 10 18 33 34 41 51 58 85 89
A: Given information: Minimum value is 3. The maximum value is 89.
Q: Given the following data, find y'(6) 0 4 X y 2 26 3 58 4 112 7 466 9 922
A: Given data, We have to find the value of y'6. Newton's divided difference interpolation formula is,…
Q: Evaluate the following. 10) 12! 100! 11) 94,109,400 96! 12) 12P5 13) 6C3 14) 10P8 95040 **BONUS**…
A: The formula for nPr is given by... nPr = n!/(n-r)!
Q: Given the above population, what is the P(Female OR Bachelor's or more in educational attainment)?…
A: Introduction: Suppose A and B are two events of interest in a study. Let P (A), P (B), and P (A ∩ B)…
Q: After giving a test to a group of students, below is the summary of grades and gender. A В C Total…
A: A B C Total Male 12 20 19 51 Female 11 18 6 35 Total 23 38 25 86
Q: P'ERCENT TO DECIMAL, DECİMAL TO PERCENT 25. 0.06 26. 0.07 27. 0.01 28. 0.02 29. 0.003 30. 0.009 31.…
A: For the given question, we have to change percent to decimal and decimal to percent. As per…
Q: Select the appropriate answer for the following diagram. Weather Profile in Wonderland Sunny 61.54%…
A: Explanation of the answer is as follows
Q: From the following data: 24, 109, 16, 128, 46, 86, 57, 37 The median
A:
Q: Frequency 10+ 8+ 6- 4- 2 1 35 79 data 9 11 13
A: Based on the histogram given below, to determine the frequency of the class containing the value 6.…
Q: Use the currency exchange rates in the table for the following question. Dollars per Foreign per…
A: Solution :-
Q: 4. Use the given histogram to answer the following: Temperatures in Cleveland 6- 51 Frequency 3 N L…
A: Statisticians use histogram to graphically represent continuous data.
Q: From the following table, calculate the frequencies of the remaining classes : (А) %3D 50 (АВ) 3 30…
A:
Q: 4) Give the five-number summary of the data shown in the boxplot below: 50 60 70 80
A: Boxplot is one of the graphical methods that is drawn for the quantitative variable to explain the…
Q: Use the data in the table below to find the population density of Maine in people per square mile.…
A: The given question has been solved in detail
Q: Determine which of the following measurement numbers is most accuratie: 5.28, 1.2,0.004;9 a Gallery…
A:
Q: A population data set produced the following information. N = 440, Ex = 4080, E y = 2430, xy =…
A:
Q: Complete the following table and answer the questions Table 2: Frequency distribution of…
A: Since you have posted a question with multiple subparts, we will solve first three subparts for you.…
Q: 13 4. 40 9. 0.326 124 5. 33 10. 3.74
A: (4) Consider the provided expression, 1340 Identify the properties of the following illustrations.…
Q: On the basis of a population survey, there were 84.4 million males and 98.2 million females 25…
A: a) Males Relative Frequency 10.3 0.1220 29.4 0.3483 14.1 0.1671 7.5 0.0889 17.3 0.2050…
Q: What is the median for the following Pounds of Honey Collected Per Hive 50 51 52 70 71 2 3 14 i5 16…
A: Given,
Q: scores in their technical exam (in percentage). APPLICANT SCORE APPLICANT SCORE 1 Ana 75.2 11 Mia…
A: Solution: The observation in increasing order are 50.5, 58.5, 60.3, 63.3, 63.4, 68.7, 71.2, 74.2,…
Q: Convert the following distribution into 'more than' frequency distribution. 40 80 100 60 Weekly…
A: Given data : Weekly wages (less than '00 Rs) Number of workers 20 41 40 92 60 156 80 194…
Q: The country of Littleland has ten working households. The annual wages for each household are shown…
A: Arrange the given data in ascending order: Household Annual wages Perkins $17000 Chan $23000…
Q: Determine the median of the following set of values. Round to the nearest tenth when applicable. 61…
A:
Q: Use the currency exchange rates in the table for the following question. Dollars per Foreign 1.414…
A: Given that
Q: A population data set produced the following information. N= 30 Σx 9980, Σy= 1455, Σw= 85,040 E2 =…
A: The given is, N=250, Σx=9980, Σy=1455, Σxy=85,040Σx2=486,820 Σy2=136,745
Q: the following set of data and answer Questions 4 through 6. 5 4. 4. 4) Determine the Mean of the set…
A: Note: As per company policy we should solve only 1 question. So, kindly repost other questions…
Step by step
Solved in 2 steps with 1 images