A First Course in Probability (10th Edition)
10th Edition
ISBN: 9780134753119
Author: Sheldon Ross
Publisher: PEARSON
expand_more
expand_more
format_list_bulleted
Question

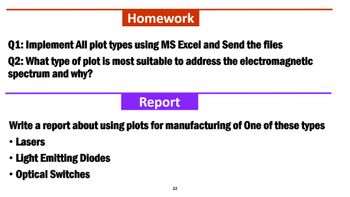
Transcribed Image Text:Homework
Q1: Implement All plot types using MS Excel and Send the files
Q2: What type of plot is most suitable to address the electromagnetic
spectrum and why?
Report
Write a report about using plots for manufacturing of One of these types
•
•
Lasers
Light Emitting Diodes
• Optical Switches
22
Expert Solution
This question has been solved!
Explore an expertly crafted, step-by-step solution for a thorough understanding of key concepts.
Step by stepSolved in 2 steps

Knowledge Booster
Similar questions
- I need help with part barrow_forwardPLEASE USE THE TABLE PROVIDED TO ANSWER THE QUESTION: John Doe Films is producing the next Batman movie. With the information available for Public Opinion and money Collected on Opening Day, what is the projected amount of money that will be collected if surveys indicate a public opinion of 8.5 for the new Batman movie? Can this projected amount of money be considered an accurate amount? Construct any plot(s)/graph(s) to support your answer.arrow_forwardlity Discussion ebook F2 W dex. .html?deploymentid=610045247065290150424417766&elSBN=9780357131466&snapshotid=3411615&id Managerial Report In making this assessment for Gebhardt Electronics, consider the following three questions: # 1. If the new supplier does provide spools of .20-mm solid OFE copper wire that average 50 inches between flaws, how is the length of wire between two consecutive flaws distributed? 2. Using the probability distribution you identified in (1), what is the probability that Gebhardt's criteria will be met (i.e., a 1 in 20 chance that a randomly selected 3-foot segment of wire provided by the new supplier will be flawless)? 3 3. In inches, what is the minimum mean length between consecutive flaws that would result in satisfaction of Gebhardt's criteria? 4. In inches, what is the minimum mean length between consecutive flaws that would result in a 1 in 100 chance that a randomly selected 3-foot segment of wire provided by the new supplier will be flawless? E 20…arrow_forward
- Match the chart type to whether it is used primarily to communicate qualitative or quantitative results: Chart Type 1. Pie chart 2. Box and whisker plot 3. Word cloud 4. Symbol map 5. Scatter plot 6. Line chart Quantitative or Qualitative?arrow_forwardQuestion 3 The test scores from Mrs. Gray's math class are shown below. 72, 73, 66, 71, 82, 85, 95, 85, 86, 89, 91, 92 Construct a box-and-whisker plot to display these data. + + + 65 70 75 80 85 90 95 100 Edit View Insert Format Tools Table 12pt v Paragraph v BIUA e T?varrow_forwardThe data in the accompanying table represent the length of life, in years, measured to the nearest tenth, of 30 similar fuel pumps. Complete parts (a) through (c) below. Click the icon to view the fuel pump data. (a) Construct a stem-and-leaf plot for the life in years of the fuel pumps, using the digit to the left of the decimal point as the stem for each observation. Stem Leaf Frequency Get more help. Fuel Pump Life Spans 2.4 3.3 0.4 3.1 1.3 0.2 0.5 5.6 5.9 6.2 0.5 2.4 1.4 4.3 6.3 1.7 4.9 0.2 4.6 0.4 1.5 0.5 2.3 4.8 1.0 5.6 5.9 6.0 1.2 0.2 Print Done -X eck answarrow_forward
- Please answer the following including the conditions that need to be met and how to compute the answer using a graphing calculator. Thank you.arrow_forwardprg/math/cc-sixth-grade-math/cc-6th-data-statistics/cc-6th-box-whisker-plots/e/analyzıng Reading box plots AP.STATS: UNC-1 (EU), UNC-1.L (LO), UNC-1.L.1 (EK), UNC-1.L.2 (EK) CCSS.Math: 6.SP.A.2, 6.SP.B.4, 6.SP.B.5, 6.SP.B.5c E Google Classroom A Facebook y Twitter Find the median of the data in the box plot below. pencils Number of pencils in each student's desk ++ 4 6. 8. 10 12 14 Stuck? Watch a viden or use hint Do 4 problerarrow_forwardPlease don't provide handwritten solution ....arrow_forward
- What type of data (nominal, ordinal, interval, or ratio) is shown in this chart? What can you learn and what do you not see in this chart?arrow_forwardBased on the box plot, what are the range and ther interquartile range?arrow_forwardI can do the scatter plot diagram I just need help With identifying the Y axis and the X access and the Form directions strength And outlierarrow_forward
arrow_back_ios
SEE MORE QUESTIONS
arrow_forward_ios
Recommended textbooks for you
 A First Course in Probability (10th Edition)ProbabilityISBN:9780134753119Author:Sheldon RossPublisher:PEARSON

A First Course in Probability (10th Edition)
Probability
ISBN:9780134753119
Author:Sheldon Ross
Publisher:PEARSON
