
MATLAB: An Introduction with Applications
6th Edition
ISBN: 9781119256830
Author: Amos Gilat
Publisher: John Wiley & Sons Inc
expand_more
expand_more
format_list_bulleted
Related questions
Question
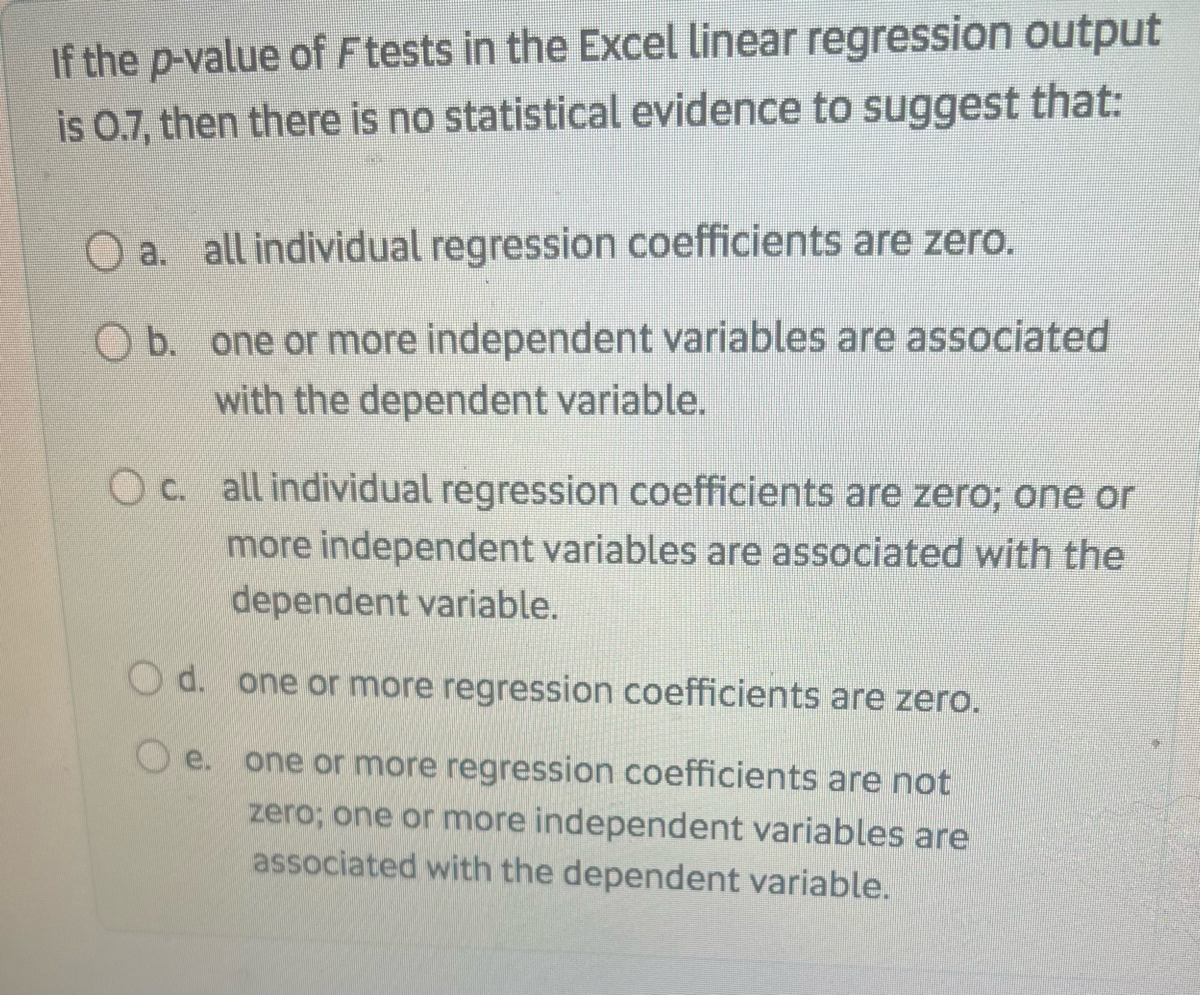

Transcribed Image Text:If the p-value of F tests in the Excel linear regression output
is 0.7, then there is no statistical evidence to suggest that:
O a. all individual regression coefficients are zero.
O b. one or more independent variables are associated
with the dependent variable.
O c. all individual regression coefficients are zero; one or
more independent variables are associated with the
dependent variable.
O d. one or more regression coefficients are zero.
O e.
one or more regression coefficients are not
zero; one or more independent variables are
associated with the dependent variable.
Expert Solution
This question has been solved!
Explore an expertly crafted, step-by-step solution for a thorough understanding of key concepts.

Step by stepSolved in 2 steps

Knowledge Booster

Similar questions
- A vocational counselor uses the number of days without employment to predict her clients' feelings of self efficacy, measured on a scale of 1 to 5, with higher numbers meaning that clients feel more secure in their job related abilities. The slope of the regression line is –1.02. Which statement is the best interpretation for this finding? a. For every 1-point increase in self-efficacy, there is an associated decrease in the number of days of unemployment. b. For every additional day of unemployment, there is an associated decrease in self-efficacy of 1.02 points. c. The least number of days a person can be unemployed and still feel self-efficacious is 3.98 points d. The decrease in self-efficacy of 1.02 points is caused by each additional day of unemploymentarrow_forwardIf all the points of a scatter diagram lie on the least squares regression line, then the coefficient of determination for these variables based on these data _____. Select one: A. is 0 B. could be any value between -1 and 1 C. is either 1 or -1, depending upon whether the relationship is positive or negative D. is 1arrow_forwardBody Fat. Where we considered the regression of percentage of body fat on nine body measurements: height, weight, hip, forearm, neck, wrist, triceps, scapula, and sup. Use the technology of your choice to do the following. a. Use the maximum- R2 criterion to obtain a regression equation for these data. b. Use the adjusted- R2 criterion to obtain a regression equation for these data. c. Use the Mallows’ Cp criterion to obtain a regression equation for these data. d. Are the regression equations obtained in parts (a), (b), and (c) the same? e. Use the analysis in parts (a), (b), and (c) to select a regression equation for these data. For the regression equation that you selected, obtain plots of residuals versus fitted values, residuals versus the included predictor variables, and a normal probability plot of the residuals. Perform a residual analysis to assess the appropriateness of the regression equation, constancy of the conditional standard deviations, and normality of the…arrow_forward
- . Interpret your result from part (a) if the assumptions for regression inferences hold. Choose the correct interpretation below. A. Presuming that the variables age and price for Corvettes satisfy the assumptions for regression inferences, the standard error of the estimate provides an estimate for the common population standard deviation, σ, of ages for all Corvettes of any particular price. B. Presuming that the variables age and price for Corvettes satisfy the assumptions for regression inferences, the standard error of the estimate provides an estimate for the slope, β1, of the population regression equation for ages for all Corvettes of any particular price. C. Presuming that the variables age and price for Corvettes satisfy the assumptions for regression inferences, the standard error of the estimate provides an estimate for the common population standard deviation, σ, of prices for all Corvettes of any particular age. D. Presuming that…arrow_forwardSelect all statements that are true of the least-squares regression line. ) It assumes a linear relationship between the explanatory and the response variable. R-squared is the portion of sample variance in the explanatory variable that can be explained by variation in the response variable. ) It can be used to predict the mean response of the explanatory variable. | R-squared is the portion of sample variance in the y variable that can be explained by variation in the x variable.arrow_forwardSuppose that x and y are two variables of a population and that the assumptions for regression inferences are met with x as the predictor variable and y as the response variable. a. What statistic is used to estimate the slope of the population regression line? b. What statistic is used to estimate the y-intercept of the population regression line? c. What statistic is used to estimate the common conditional standard deviation of the response variable corresponding to fixed values of the predictor variable?arrow_forward
arrow_back_ios
arrow_forward_ios
Recommended textbooks for you
- MATLAB: An Introduction with ApplicationsStatisticsISBN:9781119256830Author:Amos GilatPublisher:John Wiley & Sons Inc
 Probability and Statistics for Engineering and th...StatisticsISBN:9781305251809Author:Jay L. DevorePublisher:Cengage Learning
 Statistics for The Behavioral Sciences (MindTap C...StatisticsISBN:9781305504912Author:Frederick J Gravetter, Larry B. WallnauPublisher:Cengage Learning
  Elementary Statistics: Picturing the World (7th E...StatisticsISBN:9780134683416Author:Ron Larson, Betsy FarberPublisher:PEARSON
 The Basic Practice of StatisticsStatisticsISBN:9781319042578Author:David S. Moore, William I. Notz, Michael A. FlignerPublisher:W. H. Freeman
 Introduction to the Practice of StatisticsStatisticsISBN:9781319013387Author:David S. Moore, George P. McCabe, Bruce A. CraigPublisher:W. H. Freeman
MATLAB: An Introduction with Applications
Statistics
ISBN:9781119256830
Author:Amos Gilat
Publisher:John Wiley & Sons Inc
Probability and Statistics for Engineering and th...
Statistics
ISBN:9781305251809
Author:Jay L. Devore
Publisher:Cengage Learning
Statistics for The Behavioral Sciences (MindTap C...
Statistics
ISBN:9781305504912
Author:Frederick J Gravetter, Larry B. Wallnau
Publisher:Cengage Learning
Elementary Statistics: Picturing the World (7th E...
Statistics
ISBN:9780134683416
Author:Ron Larson, Betsy Farber
Publisher:PEARSON
The Basic Practice of Statistics
Statistics
ISBN:9781319042578
Author:David S. Moore, William I. Notz, Michael A. Fligner
Publisher:W. H. Freeman
Introduction to the Practice of Statistics
Statistics
ISBN:9781319013387
Author:David S. Moore, George P. McCabe, Bruce A. Craig
Publisher:W. H. Freeman