
MATLAB: An Introduction with Applications
6th Edition
ISBN: 9781119256830
Author: Amos Gilat
Publisher: John Wiley & Sons Inc
expand_more
expand_more
format_list_bulleted
Related questions
Question
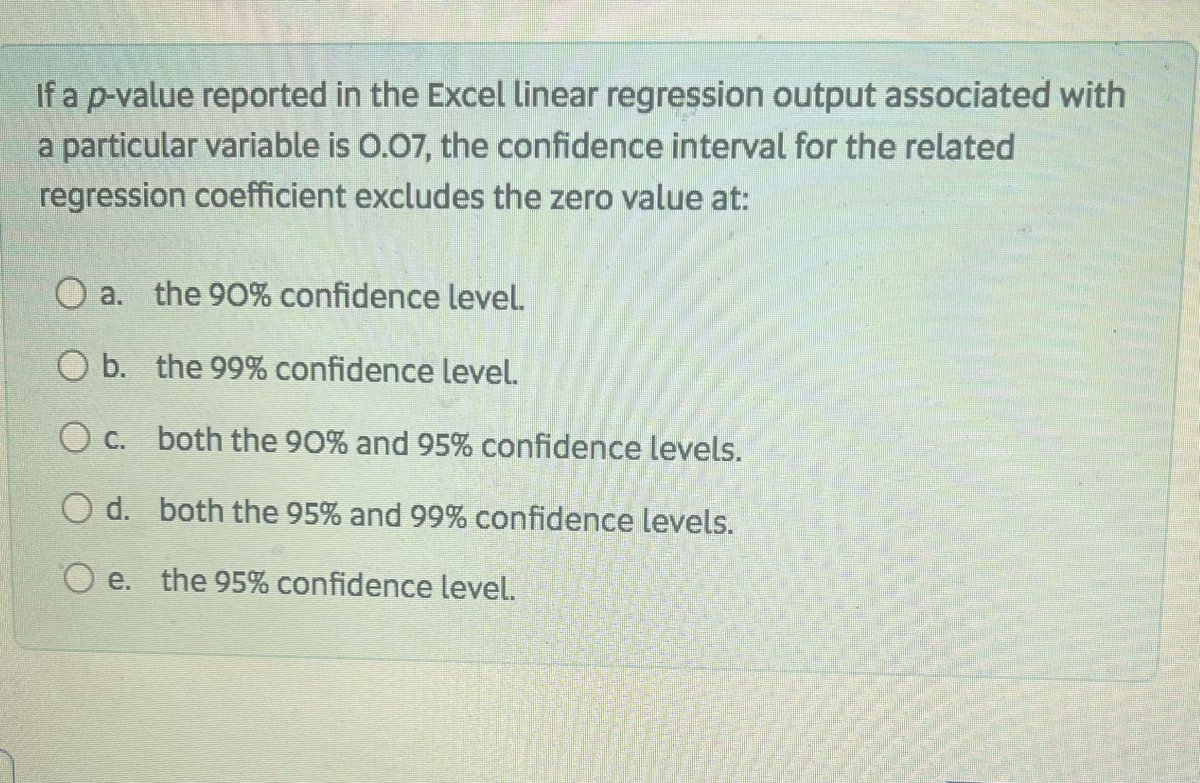

Transcribed Image Text:If a p-value reported in the Excel linear regression output associated with
a particular variable is 0.07, the confidence interval for the related
regression coefficient excludes the zero value at:
O a. the 90% confidence level.
O b. the 99% confidence level.
O c. both the 90% and 95% confidence levels.
O d. both the 95% and 99% confidence levels.
O e. the 95% confidence level.
Expert Solution
This question has been solved!
Explore an expertly crafted, step-by-step solution for a thorough understanding of key concepts.

Step by stepSolved in 2 steps

Knowledge Booster

Similar questions
- The table below lists measured amounts of redshift and the distances (billions of light-years) to randomly selected astronomical objects. There is sufficient evidence to support a claim of a linear correlation, so it is reasonable to use the regression equation when making predictions. For the prediction interval, use a 90% confidence level with a redshift of 0.0126. Find the explained variation. Redshift Distance OA, 0.157904 OB. 0.444904 OC. 0.000582 OD. 0.219582 0.0231 0.34 0.0536 0.76 0.0715 0.99 0.0391 0.56 0.0438 0.63 0.0109 0.15arrow_forwardIn this question, we investigate the relationship between the top (maximum) speed (mph) and maximum height for a random sample of roller coasters in the United States. Here is the scatterplot and a summary of the simple linear regression model. Construct a 95% confidence interval for the true slope of the regression line and interpret your confidence interval in context.arrow_forwardLet's study the relationship between brand, camera resolution, and internal storage capacity on the price of smartphones. Use α = .05 to perform a regression analysis of the Smartphones01CS dataset, and then answer the following questions. When you copy and paste output from MegaStat to answer a question, remember to choose to "Keep Formatting" to paste the text. a. Did you find any evidence of multicollinearity and variance inflation among the predictors. Explain your answer using a VIF analysis. b. Copy and paste the normal probability plot for your analysis. Is there any evidence that the errors are not normally distributed? Explain. c. Copy and paste the Residuals vs. Predicted Y-values. Does the pattern support the null hypothesis of constant variance for the errors? Explain. d. Study the residuals analysis. Which observations, if any, have unusual residuals? e. Study the residuals analysis. Calculate the leverage statistic. Which observations, if any, are high leverage…arrow_forward
- The ANOVA summary table to the right is for a multiple regression model with six independent variables. Complete parts (a) through (e). a. Determine the regression mean square (MSR) and the mean square error (MSE). (Round to four decimal places as needed.) (Round to four decimal places as needed.) MSR= MSE = b. Compute the overall FSTAT test statistic. FSTAT (Round to two decimal places as needed.) C Source Regression Error Total Degrees of Sum of Freedom Squares 240 190 430 6 26 32arrow_forwardConsider the following computer output from a multiple regression analysis relating the cost of car insurance to the variables: number of car accidents, driver's credit score, and safety rating of the car. Coefficients Coefficients Standard Error t Stat P-value Intercept 956 97.23 9.832 0.0000 Car Accidents 172.08 18.24 9.434 0.0000 (In last 3 years) Credit Score Safety Rating 105.16 201.03 0.523 0.6030 -207.81 20.46 - 10.157 0.0000 Does the sign of the coefficient for the variable credit score make sense? Answer No, because it is expected that as the credit score increases then the cost should decrease. ○ No, because it is expected that as the credit score increases then the cost should also increase. ○ Yes, because it is expected that as the credit score increases then the cost should decrease. ○ Yes, because it is expected that as the credit score increases then the cost should also increase. Tables Keypad Keyboard Shortcutsarrow_forwardThe value obtained for the test statistic, z, in a one-mean z-test is given. Also given is whether the test is two tailed, left tailed, or right tailed. Also is given the P-value.A left-tailed test: z = -1.17 P-value: 0.1210 Use technology to create a scatter plot of the data from the previous question. Include the regression line. (Hand drawn graphs will not be accepted.) The explanatory (input) variable and the response (output) variable must be clearly labeled, within the context of this problem.arrow_forward
arrow_back_ios
arrow_forward_ios
Recommended textbooks for you
- MATLAB: An Introduction with ApplicationsStatisticsISBN:9781119256830Author:Amos GilatPublisher:John Wiley & Sons Inc
 Probability and Statistics for Engineering and th...StatisticsISBN:9781305251809Author:Jay L. DevorePublisher:Cengage Learning
 Statistics for The Behavioral Sciences (MindTap C...StatisticsISBN:9781305504912Author:Frederick J Gravetter, Larry B. WallnauPublisher:Cengage Learning
  Elementary Statistics: Picturing the World (7th E...StatisticsISBN:9780134683416Author:Ron Larson, Betsy FarberPublisher:PEARSON
 The Basic Practice of StatisticsStatisticsISBN:9781319042578Author:David S. Moore, William I. Notz, Michael A. FlignerPublisher:W. H. Freeman
 Introduction to the Practice of StatisticsStatisticsISBN:9781319013387Author:David S. Moore, George P. McCabe, Bruce A. CraigPublisher:W. H. Freeman
MATLAB: An Introduction with Applications
Statistics
ISBN:9781119256830
Author:Amos Gilat
Publisher:John Wiley & Sons Inc
Probability and Statistics for Engineering and th...
Statistics
ISBN:9781305251809
Author:Jay L. Devore
Publisher:Cengage Learning
Statistics for The Behavioral Sciences (MindTap C...
Statistics
ISBN:9781305504912
Author:Frederick J Gravetter, Larry B. Wallnau
Publisher:Cengage Learning
Elementary Statistics: Picturing the World (7th E...
Statistics
ISBN:9780134683416
Author:Ron Larson, Betsy Farber
Publisher:PEARSON
The Basic Practice of Statistics
Statistics
ISBN:9781319042578
Author:David S. Moore, William I. Notz, Michael A. Fligner
Publisher:W. H. Freeman
Introduction to the Practice of Statistics
Statistics
ISBN:9781319013387
Author:David S. Moore, George P. McCabe, Bruce A. Craig
Publisher:W. H. Freeman