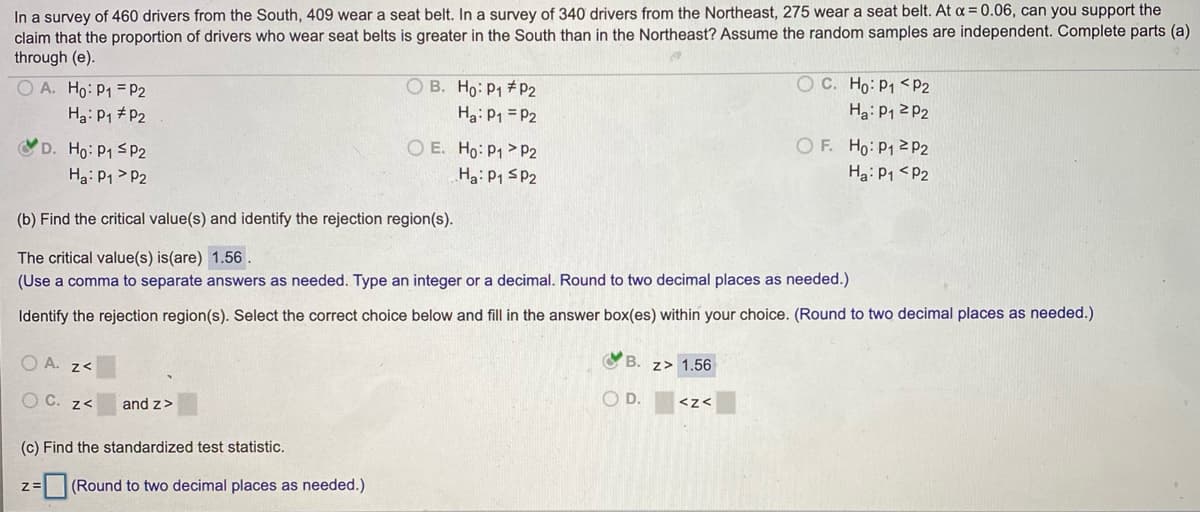
In a survey of 460 drivers from the South, 409 wear a seat belt. In a survey of 340 drivers from the Northeast, 275 wear à seat bēlt. At & = U.06, can you support claim that the proportion of drivers who wear seat belts is greater in the South than in the Northeast? Assume the random samples are independent. Complete p through (e). O B. Ho: P1 #P2 O C. Ho: P1 P2 O E. Ho: P1 > P2 Ha: P1 SP2 Ha: P1 1.56 O C. z< and z> OD.


Inverse Normal Distribution
The method used for finding the corresponding z-critical value in a normal distribution using the known probability is said to be an inverse normal distribution. The inverse normal distribution is a continuous probability distribution with a family of two parameters.
Mean, Median, Mode
It is a descriptive summary of a data set. It can be defined by using some of the measures. The central tendencies do not provide information regarding individual data from the dataset. However, they give a summary of the data set. The central tendency or measure of central tendency is a central or typical value for a probability distribution.
Z-Scores
A z-score is a unit of measurement used in statistics to describe the position of a raw score in terms of its distance from the mean, measured with reference to standard deviation from the mean. Z-scores are useful in statistics because they allow comparison between two scores that belong to different normal distributions.

Step by step
Solved in 2 steps with 4 images


