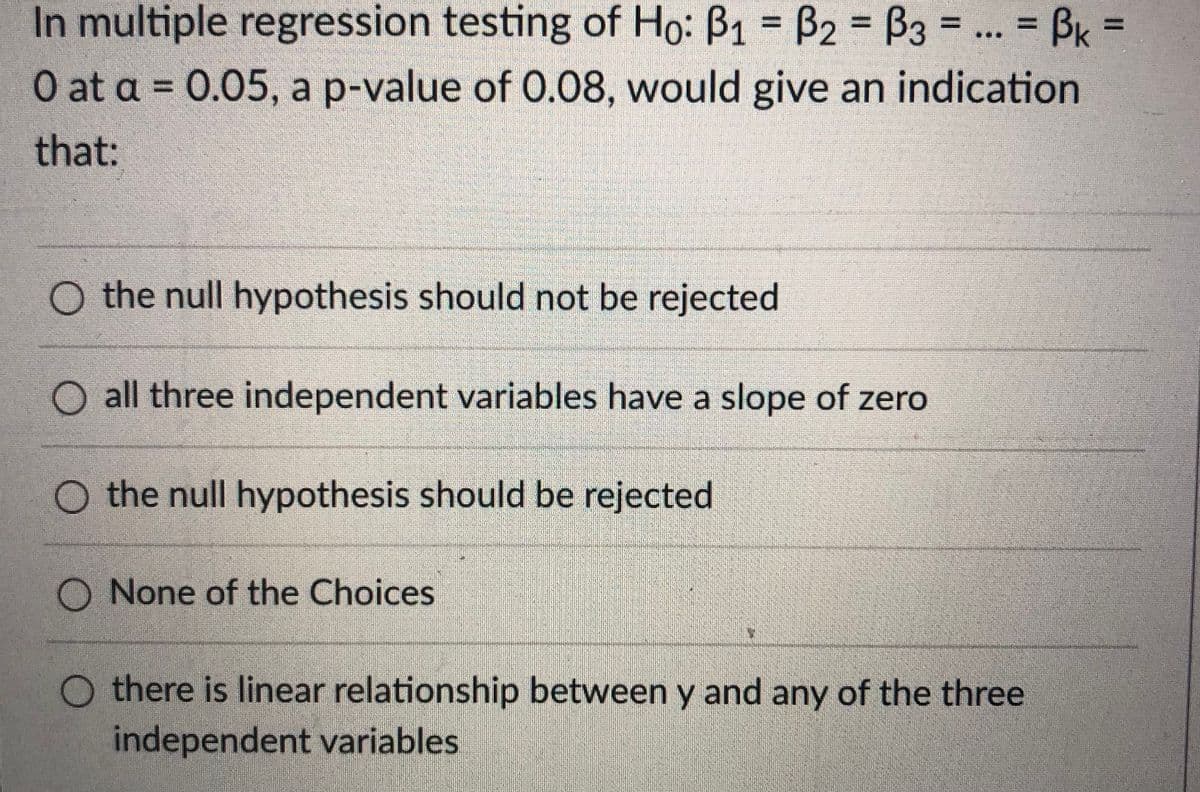
In multiple regression testing of Ho: B1 = B2 = B3 ... = BK O at a = 0.05, a p-value of 0.08, would give an indication %3D %3D %3D that: O the null hypothesis should not be rejected O all three independent variables have a slope of zero O the null hypothesis should be rejected O None of the Choices O there is linear relationship between y and any of the three


Q: of the following statements regarding Linear Regression is FALSE? (pick one) * F-statistic is used…
A: a) F-statistics is used to measure the overall regression model. It is another way of finding the…
Q: he following data shows the dexterity test scores of five assembly-line employees of Dimples Company…
A: Since you have asked multiple questions, we will solve the first question for you. If you want any…
Q: 1 Let kids denote the number of children ever born to a woman, and let educ denote years of…
A: 1. Some factors that might be contained in the error term are family income, age of the mother,…
Q: Suppose that a researcher wishes to test for calendar (seasonal) effects using a dummy variables…
A: Regression is a statistical method used in finance, investing, and other disciplines that attempts…
Q: Consider the following regression equation: Y,= Po+PX;+Hi where X, Y. Bo. B1, and , denote the…
A: Finding the heteroskedastic-robust estimator of the variance β^1
Q: 1) Indicate whether the following statements are true or false. Explain why and show your work. c)…
A: given In the regression Y= B1+ B2X + B3Z+u if there is a strong linear correlation between X and…
Q: Which of the following statements is NOT correct about slope of a regression line? O a. A slope of…
A:
Q: In regression with multiple input variables, which of the following can be a problem for finding…
A: Multiple regression analysis is also known as multiple linear regression (MLR) is a statistical…
Q: A researcher interested in explaining the level of foreign reserves for the country of Barbados…
A: Note: " Since you have posted a question with multiple sub-parts, we will solve first three…
Q: The manufacturer of Beanie Baby dolls used quarterly price data for 2005 - 2013 IV (t= 1,..., 36)…
A:
Q: The following regression output was obtained from a study of architectural firms. The dependent…
A: From the provided information, Residual degree of freedom = 50 Level of significance (α) = 0.05…
Q: The following regression output was obtained from a study of architectural firms. The dependent…
A: Given Information Predictor Coefficient SE T-VALUE P-value Constant 7.096 3.245 2.187 0.01…
Q: The manufacturer of Beanie Baby dolls used quarterly price data for 2012/- 2020/ (t 1, ., 36) and…
A: It is needed to test whether there is a significant trend in the price of dolls.
Q: A ski resort asked a random sample of guests to rate their satisfaction on various attributes of…
A: Note: Hi there! Thank you for posting the question. As there are multiple sub parts, according to…
Q: A random sample of twelve students were chosen, and their midterm test score (y), as- signment score…
A: Given, Midterm Score, y Assignment Score, x1 Classes Missed, x2 85 74 76 90 85 87 94 98…
Q: The number of initial public offeringe of stock issued in a 10-year period and the total proceeds of…
A: The regression equation is given as : y^=32.641x +17627.405 The prediction interval is the…
Q: The following regression output was obtained from a study of architectural firms. The dependent…
A: 1. c. Hypothesis: The null and alternative hypothesis are given below: H0: β1=β2=β3=β4=β5=0H1:…
Q: The accompanying data resulted from an experiment in which weld diameter and shear strength (in…
A: Here, the line of regression is given as: Strength = -941.6992 + 8.5988*Diameter Let, Strength be…
Q: In a simple linear regression model, B1 has important relationships with a sample correlation…
A: (1) To prove β^1=rSyySxx The general form of regression equation is Y=β0+β1X+ε By minimizing the…
Q: A multiple regression analysis produced the following output from Minitab. Regression Analysis: Y…
A: Here as we can see the p-value for both the variables X1 and X2 is greater than 0.05 so none of the…
Q: An academic advisor wants to predict the typical starting salary of a graduate at a top business…
A: For testing whether a linear relationship exists between SALARY and GMAT, we need to test its slope…
Q: The following regression output was obtained from a study of architectural firms. The dependent…
A: Note: Hey, since multiple subparts are posted, we will answer first three subparts according to our…
Q: Consider the following data for a dependent variable y and two independent variables, x, and x2. X1…
A: a) Therefore, we find that the regression equation is: y^=45.1+1.9*x1 predict y^ if x1=51 we…
Q: A paper gave the following data on n = 11 female black bears. Age (years) Weight (kg) Home-Range…
A: Regression
Q: To test for the significance of a regression model involving 4 independent variables and 36…
A: It is given that the number of observations are 36. Here, the number of independent variables, p is…
Q: Suppose the simple linear regression model, Y; = Bo + B1 xi + E;, is used to explain the…
A: Simple linear regression model is given by yi=β0 + β1 xi+εi The simple linear regression model is…
Q: 1. From the following data and given output, determine the equation of the regression line and…
A: The correlation coefficient between the two variables can be calculated by using the cell function…
Q: population regression slope is
A: We know the Regression line shows the relationship between one dependent variable Y(weight) and the…
Q: Which of the following is/are true if the coefficient of determination between the response and the…
A: The coefficient of determination between the response and predictor variable is 81% for a random…
Q: The following regression output was obtained from a study of architectural firms. The dependent…
A: Note: Hey, since multiple sub parts are posted, we will answer first three sub parts according to…
Q: Refer to the Minitab display below, which is based on a sample of 54 bears. Identify the multiple…
A: The fitted regression equation is given as WEIGHT = - 253 - 0.85*HEADLEN + 0.64*LENGTH + 12.1*CHEST
Q: Which of the following statements is truc about linear regression analysis of quantitative…
A: Introduction: The correct statement regarding regression analysis of quantitative variables must be…
Q: 12) Use computer software to find the best multiple regression equation to explain the variation in…
A:
Q: The data shown below for the dependent variable, y, and the independent variable, x, have been…
A: Hi! Thank you for the question, As per the honor code, we are allowed to answer three sub-parts at a…
Q: Which of the following residual plots suggests that a linear model may not be applicable to the data…
A: The residuals (e) are calculated by taking difference between observed value and predicted value…
Q: The manufacturer of Beanie Baby dolls used quarterly price data for 2012/-2020/V(t = 1, ..., 36) and…
A:
Q: A simple linear regression analysis based on a data set that consists of 20 observations yielded the…
A:
Q: (a) Develop an estimated regression equation relating y to x1. (Round your numerical values to one…
A: (a) The regression analysis is conducted using EXCEL. The software procedure is given below: Enter…
Q: sixth-grade teacher believes that there is a relationship between his students’ IQ scores (y) and…
A:
Q: The following is a partial computer output of a multiple regression analysis of a data set…
A: The provided information is: The regression equation is,SALEPRIC = 1470 + 0.814 LANDVAL + 0.820…
Q: Which of the following would affect the reliability of a forecast made using linear regression? (i)…
A: One of the basic assumptions in linear regression is the assumption of linear relationship between…
Q: Consider the following correlations -0.9 , -0.5 , -0.2 , 0 , 0.2 , 0.5 and 0.9. For each give the…
A: Given, the correlations -0.9 , -0.5 , -0.2 , 0 , 0.2 , 0.5 and 0.9. We need to calculate the…
Q: What is the predicted response value? (Report answer accurate to one decimal place.) y =…
A: Given : X Y 43.8 54.1 41.3 51.2 35.3 60.1 48.1 44.9 42.8 51.8 44.7 50.8 39.4…
Q: The authors of a paper were interested in how the distance a deer mouse will travel for food is…
A: Given, Dependent variable= Distance travelled Independent variable= Distance from Debris Slope=3.23…
Q: Given the following quantities for a simple linear regression model results from a sample of sizen-8…
A: The values of the sum of square, SSxy, SSyy, SSxx are determined using the formula, SSxy=∑xy-∑x∑yn,…
Q: The following regression output was obtained from a study of architectural firms. The dependent…
A: Note: Hi there! Thank you for posting the question. As your question has more than 3 parts, we have…
Q: (A) In basic ANOVA, the F ratio is the ratio of:" a,SSM/df1 and SSE/df2 b.SSM/df1 and SST/df3…
A:
Q: 12. Which of the following statistic in the Multiple Regression Analysis SPSS output shows the…
A: The regression analysis is a statistical procedure that allows us to find the linear association…
Q: A CBD ol-based pain reliet candy bar manutacturer is interested in estimating how sales (in number…
A: The independent variable is Price. The dependent variable is Sales. We have to test whether sales…

Step by step
Solved in 2 steps with 2 images

- Olympic Pole Vault The graph in Figure 7 indicates that in recent years the winning Olympic men’s pole vault height has fallen below the value predicted by the regression line in Example 2. This might have occurred because when the pole vault was a new event there was much room for improvement in vaulters’ performances, whereas now even the best training can produce only incremental advances. Let’s see whether concentrating on more recent results gives a better predictor of future records. (a) Use the data in Table 2 (page 176) to complete the table of winning pole vault heights shown in the margin. (Note that we are using x=0 to correspond to the year 1972, where this restricted data set begins.) (b) Find the regression line for the data in part ‚(a). (c) Plot the data and the regression line on the same axes. Does the regression line seem to provide a good model for the data? (d) What does the regression line predict as the winning pole vault height for the 2012 Olympics? Compare this predicted value to the actual 2012 winning height of 5.97 m, as described on page 177. Has this new regression line provided a better prediction than the line in Example 2?If a sample of 25 pairs of data yields a correlation coefficient, r, of 0.390 and the scatterplot displays a linear trend, can you use the regression equation to make predictions, assuming your x-values are within the domain of the data set? Choose your answer from the multiple choice answers below A.) Yes, because rcrit = 0.396 and the regression coefficient, r, is less than this value. B.) Yes, because rcrit = 0.381 and the regression coefficient, r, is greater than this value. C.) No, because rcrit = 0.381 and the regression coefficient, r, is greater than this value. D.) No, because rcrit = 0.396 and the regression coefficient, r, is less than this value.In the following model, "employed" is a dummy indicating a person is employed: donation = B + B edu + Bemployed + uT Running this model will produce the same results of differential in donation between employed people and unemployed people as running two separate regressions for employed people and unemployed people. A. True B. False
- A random sample of twelve students were chosen, and their midterm test score (y), as- signment score (x1), and missed classes (x2) were recorded as follows: Midterm Score, y Assignment Score, x1 Classes Missed, x2 85 74 76 90 85 87 94 98 81 91 76 74 65 50 55 65 55 70 65 70 55 70 50 55 5 7 5 2 6 3 2 5 4 3 1 4 (i) What is the fitted multiple linear regression equation of the form yˆ = b0 + b1x1 + b2x2? (ii) From part (i) above, estimate the midterm test score grade for a student who has an assignment score of 60 and missed 4 classes.Which of the multivariate regression parameters listed below would be best interpreted as: the predicted value on the dependent variable when all of the independent variables in the model are equal to zero. a b1 X1 R2A researcher recorded the number of e-mails received in a month and the number of online purchases made during that month for 50 people with an online presence. The resulting data were used to conduct a hypothesis test to investigate whether the slope of the population regression line relating number of e-mails received to number of online purchases is positive. What are the correct hypotheses for the test? H0:β1=0Ha:β1≠0H0:β1=0Ha:β1≠0 A H0:β1=0Ha:β1>0H0:β1=0Ha:β1>0 B H0:β1=0Ha:β1<0H0:β1=0Ha:β1<0 C H0:β1>0Ha:β1=0H0:β1>0Ha:β1=0 D H0:b1=0Ha:b1≠0 E
- A researcher notes that, in a certain region, a disproportionate number of software millionaires were born around the year 1955. Is this a coincidence, or does birth year matter when gauging whether a software founder will besuccessful? The researcher investigated this question by analyzing the data shown in the accompanying table. Complete parts a through c below. a. Find the coefficient of determination for the simple linear regression model relating number (y) of software millionaire birthdays in a decade to total number (x) of births in the region. Interpret the result. The coefficient of determination is 1.___? (Round to three decimal places as needed.) This value indicates that 2.____ of the sample variation in the number of software millionaire birthdays is explained by the linear relationship with the total number of births in the region. (Round to one decimal place as needed.) b. Find the coefficient of determination for the simple linear regression model…The following is a partial computer output of a multiple regression analysis of a data set containing 20 sets of observations on the dependent variableThe regression equation isSALEPRIC = 1470 + 0.814 LANDVAL + 0.820 IMPROVAL + 13.5 AREA Predictor Coef SE Coef T P Constant 1470 5746 0.26 0.801 LANDVAL 0.8145 0.5122 1.59 0.131 IMPROVAL 0.8204 0.2112 3.88 0.0001 AREA 13.529 6.586 2.05 0.057 S = 79190.48 R-Sq = 89.7% R-Sq(adj) = 87.8% Analysis of Variance Source DF SS MS Regression 3 8779676741 2926558914 Residual Error 16 1003491259 62718204 Total 19 9783168000 For the problem above, we want to carry out the significance test about the coefficient of LANDVAL, what is the t-value for this test, and is it significant? 46.66, significant 2.05, significant 1.59, not significant 0.26, not significantThe accompanying data resulted from an experiment in which weld diameter and shear strength (in pounds) were determined for five different spot welds on steel. Below are the data collected and the regression equation. Diameter Strength 200.1 813.7 210.1 785.3 220.1 960.4 230.1 1118.0 240.0 1076.2 Strength = -941.6992 + 8.5988*Diameter The predicted y-hat value for a diameter of 201 is 864. if we observed a weld that had a diameter of 235 that had a strength 1000, what would be its residual?
- Consider the multiple regression model shown next between the dependent variable Y and four independent variables X1, X2, X3, and X4, which results in the following function:Ŷ = 33 + 8X1 − 6X2 + 16X3 + 18X4For this model, there were 35 observations; SSR = 1,544 and SSE = 600. Assume a 0.01 significance level.Based on the given information, which of the following conclusions is correct about the statistical significance of the overall model? Multiple Choice Reject the null hypothesis that β3 = 0. Do not reject the null hypothesis that β1 = β2 = β3 = β4 = 0. Reject the null hypothesis that β1 = 0. Reject the null hypothesis that β1 = β2 = β3 = β4 = 0.Consider the following correlations -0.9 , -0.5 , -0.2 , 0 , 0.2 , 0.5 and 0.9. For each give the fraction of the variation in y that is explained by the least-squares regression of y on x.In simple linear regression, most often we perform a two-tail test of the population slope 1 to determine whether there is sufficient evidence to infer that a linear relationship exists. The null hypothesis is stated as: