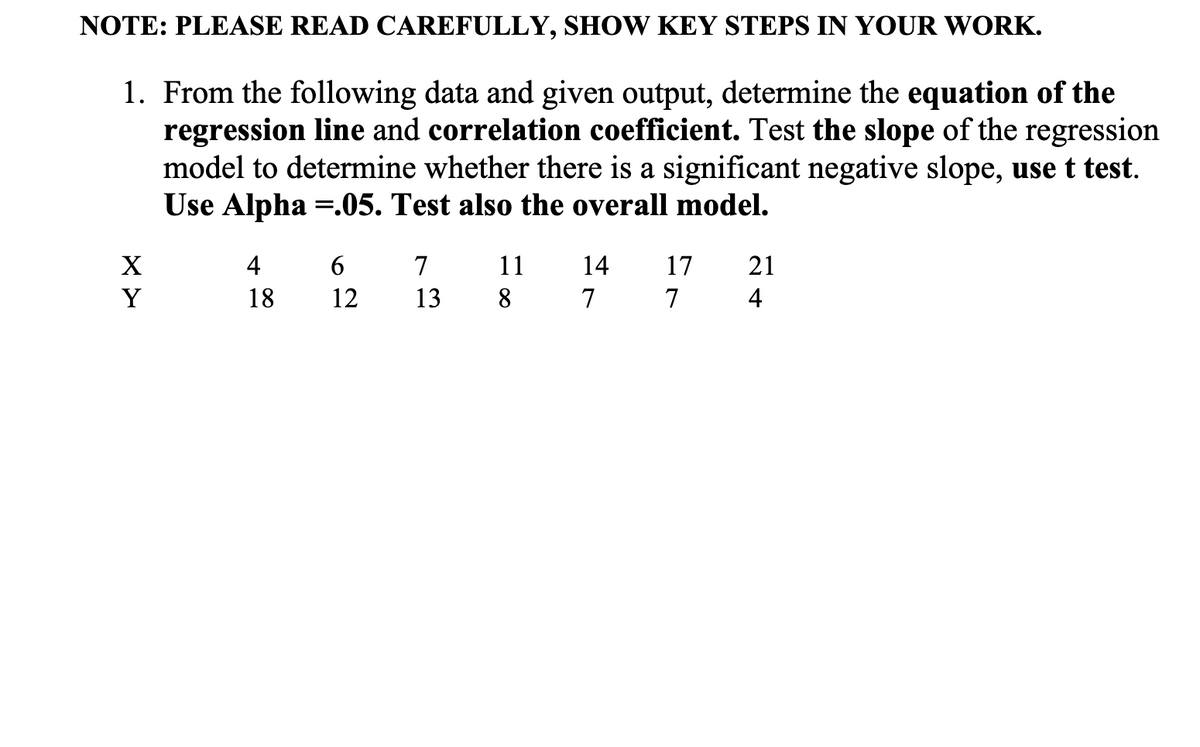
1. From the following data and given output, determine the equation of the regression line and correlation coefficient. Test the slope of the regression model to determine whether there is a significant negative slope, use t test. Use Alpha =.05. Test also the overall model. 4 7 11 14 17 21 18 12 13 8 7 7 4


Q: Consider the following data for two variables, x and y. 9 32 18 15 26 y 11 21 22 17 23 (a) Develop…
A: Let y^ denotes the predicted value of the dependent variable y. The values of x2 is determined using…
Q: For the following set of data, 3 5 5 10 10 22 8 17 4 15 7 13 Compute the Pearson correlation.…
A: Correlation coefficient is given by, Linear regression equation is given by,
Q: Consider the following data for two variables, x and y. x 9 32 18 15 26 y 9 20 21 | 17 23 (a)…
A: a) Excel Procedure: Enter X and Y data in Excel Go to Data Click on Data Analysis> ‘Regression’.…
Q: ind the sample linear correlation coefficient and interpret it. Is the population correlation…
A: X Y (x-xbar) (x-xbar)^2 (y-ybar) (y-ybar)^2 (x-xbar)*(y-ybar) 0 96 -4.5 20.25 20.3333 413.4444…
Q: For the following data: a. Find the regression equation for predicting Y from X. b. Calculate the…
A: Solution : Given : X 3 6 5 4 7 5 Y 3 9 8 3 10 9 a) Regression equation for predicting Y from…
Q: Given the following data (suppose x is the explanatory variable and y is the response variable) : x…
A: Solution: 18. The data for x and y is
Q: Solve the following problem showing the solution steps and report the final answer. Here are some…
A: Given data is Years of Experiance 1 2 4 3 5 6 3 8 9 KMiles 16 23 35 28 44 40 22 61 82
Q: The following data on price ($) and the overall score for 6 stereo headphones that were tested by…
A: For the given data find all the required blanks
Q: The following multiple regression printout can be used to predict a person's height (in inches)…
A:
Q: A statistical program is recommended. Consider the following data for two variables, x and y. x 22…
A: For the given data Regression Analysis can be done using Excel: Enter the data values in Excel sheet…
Q: 2. Consider the following data for two variables, x and y. 32 18 15 26 у 10 20 21 16 22 a. Develop…
A: Regression analysis is used to study the relationship between two or more variables. Moreover, the…
Q: Consider the following data for two variables, x and y. 9 32 18 15 26 y 10 19 20 17 21 (a) Develop…
A: Solution : Given : α = 0.05, n= 5 X 9 32 18 15 26 Y 10 19 20 17 21 a) Estimated regression…
Q: Calculate the co-efficient of correlation and the lines of regression for the following data: 1 2 3…
A: Given that X Y 1 9 2 8 3 10 4 12 5 11 6 13 7 14 8 16 9 15
Q: 1. Consider the following data of the number of hours 12 students spent online during the weekend…
A: (a) Use EXCEL to obtain the value correlation coefficient r: EXCEL procedure: Go to EXCEL Go…
Q: 6. The following data were collected to determine the relationship between pressure and the…
A: Solution-: Let, X=Pressure (lb/sq in.) and Y=Scale Reading We find the regression line Y on X
Q: The following variables include a relationship of y= a + b*(1/x). Select the regression coefficients…
A: As both the variables, x, and y have a relationship, y=a+bx, where y is the dependent variable and x…
Q: The following data on price ($) and the overall score for 6 stereo headphones that were tested by…
A:
Q: a) Determine the correlation coefficient between the percentage of people who get greater than 7…
A: Correlation are measure that used to measure the strength of association between the two numerical…
Q: Consider the following data for two variables, x and y. 32 18 15 26 y 11 | 19 20| 17 | 21 (a)…
A: Given: x y 9 9 32 19 18 22 15 17 26 23
Q: For which of the following tasks can the best-fitting regression line be used? O for predicting the…
A: The question is about regression Regression : It is a statistical method use to determine the…
Q: Consider the following data for two variables, x and y. x 22 24 26 30 35 40 y 13 20 34 35 40 36 (a)…
A: "Since you have posted a question with multiple sub-parts, we'll solve the first three sub-parts for…
Q: For the following set of data, X 3 Y 5 5 10 10 22 8 17 4 15 7. 13 Compute the Pearson correlation.…
A:
Q: 2. A. Try calculating for the regression equation and the correlation coefficient of the following…
A: The correlation coefficient and the regression does not change with the unit of the variables as…
Q: Use the given data to find the equation of the regression line. Examine the scatterplot and identify…
A: The provided information is x y xy x2 10 7.46 74.6 100 9 6.83 61.47 81 11 13.11 144.21 121…
Q: The following estimated regression equation relating sales to inventory investment and advertising…
A: Solution: Given information: n= 10 observation k= 2 independent variable Sum of square of total =…
Q: The following multiple regression printout can be used to predict a person's height (in inches)…
A: (a) Obtain the value of the test statistic for the shoe size. The value of the test statistic for…
Q: The following data on price ($) and the overall score for 6 stereo headphones that were tested by…
A: The independent variable is Score. The dependent variable is Price. This is simple linear regression…
Q: The following data on price (8) and the overall score for 6 stereo headphones that were tested by…
A: Given First enter this data into ExcelNow,
Q: Find the regression equation for predicting Y from X.
A: We will answer the first question since we only answer one question at a time. Please resubmit the…
Q: Qs- For the following data: 1 2 3 4 5 6 7 y, 9 13 14 17 18 19 19 20 a- Find the least square…
A: Step-by-step procedure to find the regression equation using Excel: In Excel sheet, enter x in one…
Q: The amount of kerosene used by a typical household in a week (Q, in litres) is found to have a…
A: Given information: Q P 11.4 4.00 14 3.50 16 3.00 18 2.50 20 2.00 22 1.50
Q: the following data to: a) determine the correlation coefficient, rounded to the nearest thousandth…
A:
Q: The following multiple regression printout can be used to predict a person's height (in inches)…
A: (a) Obtain the value of the test statistic for shoe size. The value of the test statistic for shoe…
Q: The grades of a class of 9 students on a midterm report (x) and on the final examination (y) are as…
A: Note: Hi there! Thank you for posting the question. As there are multiple sub parts, according to…
Q: Consider the following data for two variables, x and y. x 22 24 26 30 35 40 y 11 21 34 36 39 36 (a)…
A: Since you have posted a question with multiple sub-parts, we will solve first three sub-parts for…
Q: Use the following data to a. determine the coefficient of correlation, rounded to the nearest…
A: Given Subject: A B C D E F GTime watching TV: 8, 4, 2, 7, 7, 5, 6Time on the internet: 14, 12, 8,…
Q: . (a) Calculate correlation and regression coefficient from the following data: 14 2 6 8 10 12 4 2 5…
A:
Q: The data is given as follow. xi 2 6 9 13 20 Vi 7 18 9 26 23 The estimated regression equation for…
A: The given regression equation is y-hat = 7.6 + 0.9 x.Required calculations for finding SSE, SST and…
Q: Given the following data set, 10 8 13 9 11 14 6 4 12 7 5 9.14 8.14 8.74 8.77…
A: Let the fitted line be yi^=a^+b^xi.Then,b^=n∑i=1nxiyi-∑i=1nxi∑i=1nyin∑i=1nxi2-∑i=1nxi2 and…
Q: Consider the following data for two variables, x and y. x 22 24 26 30 35 40 y 11 21 34 36 39 36…
A: From the given information, x y x^2 22 11 484 24 21 576 26 34 676 30 36 900 35 39 1225…
Q: The following estimated regression equation relating sales to inventory investment and advertising…
A:
Q: The following data on price ($) and the overall score for 6 stereo headphones that were tested by…
A: Enter the given data into the excel as follows:
Q: Consider the following data. x 3 4 6 7 y 1 2 4 5 We want to predict y based on observations of x.…
A: Note: Please repost part d,e as i can answer only 3 subparts as per my policy. Given data, X Y…
Q: 8. For the following data: a. Find the regression equation for predicting Y from X. b. Calculate the…
A:
Q: Consider the following data: A. Find the equation of the regression line. B. Draw the graph of the…
A: The term regression means a return to origin. A line describing the tendency to origin is a…
Q: The mortality rate of a sample of the population as a function of daily tobacco consumption can be…
A: Given data :
Q: Calculate the co-efficient of correlation and the lines of regression for the following data: 1 2 3…
A:
Q: b. Consider the following data, Study Hours (Y) Sleeping Hours (X) 2 4 6. 8 10 13 7 10 9. 8. 7 6. 7…
A: b. i) Step-by-step procedure to find the regression equation using Excel: In Excel sheet, enter…
Q: For the following data: Y 1 5 2 10 9. 3 12 11 4 13 Find the regression equation for predicting Y…
A:
Q: Consider the following data for two variables, x and y. x 9 32 | 18 15 26 y 9 20 21 17 23 (a)…
A: a) Excel Procedure: Enter X and Y data in Excel Go to Data Click on Data Analysis> ‘Regression’.…
How do I solve this?

Step by step
Solved in 3 steps

- A sociologist was hired by a large city hospital to investigate the relationship between the number of unauthorized days that employees are absent per year and the distance (miles) between home and work for the employee. A sample of 10 employees was chosen, and the following data were collected. A. Is the estimated regression equation appropriate and adequateSuppose the following data were collected from a sample of 15 houses relating selling price to square footage and the architectural style of the house. Use statistical software to find the following regression equation: PRICEi=b0+b1SQFTi+b2COLONIALi+b3RANCHi+ei . Is there enough evidence to support the claim that on average, houses that are ranch style have lower selling prices than houses that are Victorian style at the 0.05 level of significance? If yes, write the regression equation in the spaces provided with answers rounded to two decimal places. Else, select "There is not enough evidence."Selling Price Square Footage Colonial (1 if house is Colonial style, 0 otherwise) Ranch (1 if house is Ranch style, 0 otherwise) Victorian (1 if house is Victorian style, 0 otherwise) 377640 1941 1 0 0 460996 3397 0 1 0 405781 2764 0 0 1 407216 2906 0 0 1 435139 3401 1 0 0 405275 2600 0 0 1 381141 2203 0 1 0 370490 2046 1 0 0 404070 2210 0 0 1 460196 3692 0 1 0 382780 2172 1 0 0 406466 2606 0 1…A group of students measure the length and width of a random sample of beans. They are interested in investigating the relationship between the length and width. Their summary statistics are displayed in the table below. All units, if applicable, are millimeters. Mean width: 7.555 Stdev width: 0.914 Mean height: 12.686 Stdev height: 1.634 Correlation coefficient: 0.8203 d) If the students are interested in using the height of the beans to predict the width, calculate the slope of this new regression equation. e) Write the equation of the best-fit line that can be used to predict bean widths. Use x to represent height and y to represent width.
- A researcher wants to forecast the annual sales of Walmart, based on store size. To examine the relationship between the store size in square feet and its annual sales in million dollars, a sample of 14 stores was selected shown below in the image: Answer the following: i) Null hypothesis of correlation ii) Coefficient of Correlation and its interpretation iii) Interpret the sig value of ANOVA. iv) Coefficient of Determination and its interpretation v) Write down the Regression Model. vi) Interpret the value of ‘a’ vii) Interpret the value of ‘slope’Indicate whether the following statements are true or false. Explain why and show your work. c) In the regression Y=B1 + B2 X + B3 Z + u, if there is a strong linear correlation between X and Z, then it is more likely you fail to reject the null hypotheses that individual slope parameters are insignificant.Mr. James, president of Daniel-James Financial Services, believes that there is a relationship between the number of client contacts and the dollar amount of sales. To document this assertion, he gathered the following information from a sample of clients for the last month. Let X represent the number of times that the client was contacted and Y represent the valye of sales ($1000) for each client sampled. Number of Contacts (X) Sales ($1000) 14 24 12 14 20 28 16 30 23 30 a) Compute the regression equation for client contacts and sales. Interpret the slope and intercept parameters.
- A study of the amount of rainfall and the quantity of air pollution removed produced the following data shown in table below: Daily Rainfall x (0.01 cm) Particulate Removed y (μg/m3) 7 126 7.9 129.3 7.5 125.3 9.2 120.2 10.8 116.7 5.8 119.2 5.6 138.7 2.7 147.5 9.2 110.3 Compute and interpret the coefficient of determination, and coefficient of correlation for the given data. What will be the regression equation, when swapped depended and independent variableThe accompanying data resulted from an experiment in which weld diameter and shear strength (in pounds) were determined for five different spot welds on steel. Below are the data collected and the regression equation. Diameter Strength 200.1 813.7 210.1 785.3 220.1 960.4 230.1 1118.0 240.0 1076.2 Strength = -941.6992 + 8.5988*Diameter The predicted y-hat value for a diameter of 201 is 864. if we observed a weld that had a diameter of 235 that had a strength 1000, what would be its residual?. A researcher wants to forecast the annual sales of Walmart, based on store size. To examine the relationship between the store size in square feet and its annual sales in million dollars, a sample of 14 stores was selected shown below in the picture : Answer the following: i) Null hypothesis of correlation ii) Coefficient of Correlation and its interpretation iii) Interpret the sig value of ANOVA. iv) Coefficient of Determination and its interpretation v) Write down the Regression Model. vi) Interpret the value of ‘a’ vii) Interpret the value of ‘slope’
- Dr. Spring is a consultant for the National Youth Organization of long jumpers. His goal is to predict how farany given individual will jump (4 attempts) based only on his/her height. Fortunately he had access to height and length of jumps from last year’s competition. Initial analyses of the data were as follows: contestant height (inches) (X) Length of jumps (inches) (Y) mean: 53.100 mean: 123.650 SD: 4.667 SD: 10.535 correlation coefficient= .485, p= .030 (a) Conduct a linear regressionanalysis to predict the length of jumps for the following contestants. (do not round) Contestant number one 52inches tall, length of jumps = Contestant number two 70inches tall, length of jumps = Contestant number three 77inches tall, length of jumps =Which of the following assumptions is not necessary for unbiasedness of a slope coefficient in a multiple regression model? MLR1 MLR 4 Homoskedasticity Random samplingThe regional transit authority for a major metropolitan area wants to determine whether there is any relationship between the age of a bus and the annual maintenance cost. A sample of 10 buses resulted in the data in Worksheet 2. Worksheet 2 Age of a Bus (years) Maintenance Cost ($) 1 350 2 370 2 480 2 520 2 590 3 550 4 750 4 800 5 790 5 950 Develop a scatter diagram with the age of a bus as the independent variable. Develop the estimated regression equation that can be used to predict the maintenance cost given the age of a bus. Determine the coefficient of determination, and interpret its meaning in this problem. At the 0.05 level of significance, is there evidence of a linear relationship between the age of a bus and the annual maintenance cost.
