Independent simple random samples of four regions gave the data on race as shown in the table. At the 1% significance level, do the data provide sufficient evidence to conclude that a difference exists in race distributions among the four regions? Northeast Midwest South West Total White Black 92 13 11 43 12 79 117 162 113 484 Other 526 Find the test statistic. x² = [ (Round to three decimal places as needed.) Find the P-value. 10 6 14 35 What are the null and alternative hypotheses? OA. Ho: The racial distribution is the same in each of the four regions. H₂: The racial distribution is not the same in each of the four regions. OB. Ho: The racial distribution is not the same in each of the four regions. H₂: The racial distribution is the same in each of the four regions. OC. Ho: The racial distribution is the same in at least two of the four regions. Ha: The racial distribution is not the same in at least two of the four regions. OD. Ho: The racial distribution is not the same in at least two of the four regions. Ha: The racial distribution is the same in at least two of the four regions. Total 110 138 211 139 598
Independent simple random samples of four regions gave the data on race as shown in the table. At the 1% significance level, do the data provide sufficient evidence to conclude that a difference exists in race distributions among the four regions? Northeast Midwest South West Total White Black 92 13 11 43 12 79 117 162 113 484 Other 526 Find the test statistic. x² = [ (Round to three decimal places as needed.) Find the P-value. 10 6 14 35 What are the null and alternative hypotheses? OA. Ho: The racial distribution is the same in each of the four regions. H₂: The racial distribution is not the same in each of the four regions. OB. Ho: The racial distribution is not the same in each of the four regions. H₂: The racial distribution is the same in each of the four regions. OC. Ho: The racial distribution is the same in at least two of the four regions. Ha: The racial distribution is not the same in at least two of the four regions. OD. Ho: The racial distribution is not the same in at least two of the four regions. Ha: The racial distribution is the same in at least two of the four regions. Total 110 138 211 139 598

MATLAB: An Introduction with Applications
6th Edition
ISBN:9781119256830
Author:Amos Gilat
Publisher:Amos Gilat
Chapter1: Starting With Matlab
Section: Chapter Questions
Problem 1P

Related questions
Question
Choose the correct conclusion below.
Do not reject
H0.
The data
do not provide
sufficient evidence that there is a difference.Reject
H0.
The data
do not provide
sufficient evidence that there is a difference.Reject
H0.
The data
provide
sufficient evidence that there is a difference.Do not reject
H0.
The data
provide
sufficient evidence that there is a difference.At least one assumption is violated. Therefore, the test cannot be conducted.
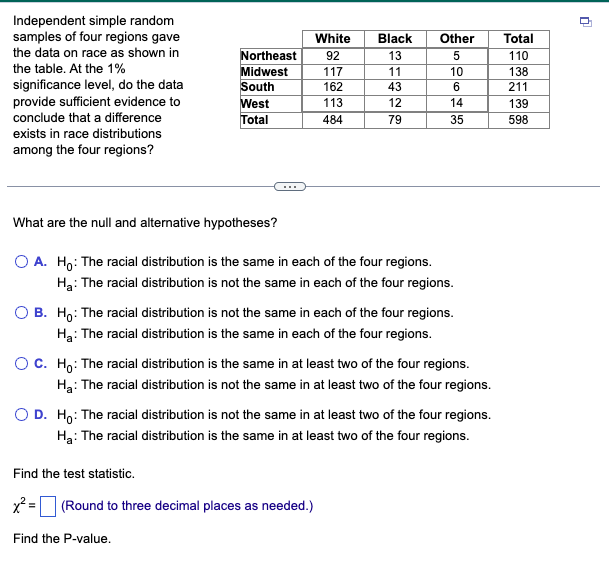
Transcribed Image Text:Independent simple random
samples of four regions gave
the data on race as shown in
the table. At the 1%
significance level, do the data
provide sufficient evidence to
conclude that a difference
exists in race distributions
among the four regions?
Northeast
Midwest
South
West
Total
White
92
117
162
113
484
Black Other
5
10
6
14
35
13
1 43 12 79
Find the test statistic.
x² = (Round to three decimal places as needed.)
Find the P-value.
11
What are the null and alternative hypotheses?
O A. Ho: The racial distribution is the same in each of the four regions.
H₂: The racial distribution is not the same in each of the four regions.
O B. Ho: The racial distribution is not the same in each of the four regions.
H₂: The racial distribution is the same in each of the four regions.
O C. Ho: The racial distribution is the same in at least two of the four regions.
Ha: The racial distribution is not the same in at least two of the four regions.
O D. Ho: The racial distribution is not the same in at least two of the four regions.
Ha: The racial distribution is the same in at least two of the four regions.
Total
110
138
211
139
598
n
Expert Solution
This question has been solved!
Explore an expertly crafted, step-by-step solution for a thorough understanding of key concepts.

Step by step
Solved in 3 steps with 1 images

Recommended textbooks for you
MATLAB: An Introduction with Applications
Statistics
ISBN:
9781119256830
Author:
Amos Gilat
Publisher:
John Wiley & Sons Inc

Probability and Statistics for Engineering and th…
Statistics
ISBN:
9781305251809
Author:
Jay L. Devore
Publisher:
Cengage Learning

Statistics for The Behavioral Sciences (MindTap C…
Statistics
ISBN:
9781305504912
Author:
Frederick J Gravetter, Larry B. Wallnau
Publisher:
Cengage Learning
MATLAB: An Introduction with Applications
Statistics
ISBN:
9781119256830
Author:
Amos Gilat
Publisher:
John Wiley & Sons Inc
Probability and Statistics for Engineering and th…
Statistics
ISBN:
9781305251809
Author:
Jay L. Devore
Publisher:
Cengage Learning
Statistics for The Behavioral Sciences (MindTap C…
Statistics
ISBN:
9781305504912
Author:
Frederick J Gravetter, Larry B. Wallnau
Publisher:
Cengage Learning

Elementary Statistics: Picturing the World (7th E…
Statistics
ISBN:
9780134683416
Author:
Ron Larson, Betsy Farber
Publisher:
PEARSON

The Basic Practice of Statistics
Statistics
ISBN:
9781319042578
Author:
David S. Moore, William I. Notz, Michael A. Fligner
Publisher:
W. H. Freeman

Introduction to the Practice of Statistics
Statistics
ISBN:
9781319013387
Author:
David S. Moore, George P. McCabe, Bruce A. Craig
Publisher:
W. H. Freeman