ion-selective electrode was immersed in standard solutions whose ionic strength was constant at 2.0 M. Ca²+ (M) E (mV) 3.38 X 10 -74.8 3.38 X 10 -46.4 3.38 X 10⁻³ 3.38 x 10⁻² 3.38 x 10⁻¹ -18.7 +10.0 +37.7 (a) Prepare a calibration curve and find the least-squares slope and intercept and their standard deviations.
ion-selective electrode was immersed in standard solutions whose ionic strength was constant at 2.0 M. Ca²+ (M) E (mV) 3.38 X 10 -74.8 3.38 X 10 -46.4 3.38 X 10⁻³ 3.38 x 10⁻² 3.38 x 10⁻¹ -18.7 +10.0 +37.7 (a) Prepare a calibration curve and find the least-squares slope and intercept and their standard deviations.

Principles of Instrumental Analysis
7th Edition
ISBN:9781305577213
Author:Douglas A. Skoog, F. James Holler, Stanley R. Crouch
Publisher:Douglas A. Skoog, F. James Holler, Stanley R. Crouch
Chapter32: Radiochemical Methods
Section: Chapter Questions
Problem 32.8QAP

Related questions
Question
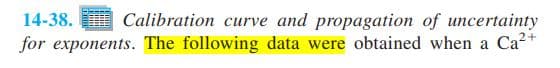
![ion-selective electrode was immersed in standard solutions whose
ionic strength was constant at 2.0 M.
Ca²+ (M)
E (mV)
3.38 X 10⁻⁵
3.38 x 10⁻⁴
3.38 X 10³
3.38 X 10⁻²
3.38 X 10⁻¹
-74.8
-46.4
-18.7
+10.0
+37.7
(a) Prepare a calibration curve and find the least-squares slope and
intercept and their standard deviations.
(b) Calculate the value of B in Equation 14-13.
(c) For a measured potential, the calibration curve gives us
log[Ca?+]. We can compute [Ca?+] = 10loglCa"I, Using rules for
propagation of uncertainty in Table 3-1, calculate [Ca²+] and its
associated uncertainty of a sample that gave a reading of
-22.5 (+0.3) mV in four replicate measurements.](/v2/_next/image?url=https%3A%2F%2Fcontent.bartleby.com%2Fqna-images%2Fquestion%2Fd12cfe09-e8dc-474e-b7dc-f9e62092a917%2Fc50bc36f-5f06-460f-b7d4-ed2243df37f6%2Frfmd289_processed.jpeg&w=3840&q=75)
Transcribed Image Text:ion-selective electrode was immersed in standard solutions whose
ionic strength was constant at 2.0 M.
Ca²+ (M)
E (mV)
3.38 X 10⁻⁵
3.38 x 10⁻⁴
3.38 X 10³
3.38 X 10⁻²
3.38 X 10⁻¹
-74.8
-46.4
-18.7
+10.0
+37.7
(a) Prepare a calibration curve and find the least-squares slope and
intercept and their standard deviations.
(b) Calculate the value of B in Equation 14-13.
(c) For a measured potential, the calibration curve gives us
log[Ca?+]. We can compute [Ca?+] = 10loglCa"I, Using rules for
propagation of uncertainty in Table 3-1, calculate [Ca²+] and its
associated uncertainty of a sample that gave a reading of
-22.5 (+0.3) mV in four replicate measurements.
Transcribed Image Text:Calibration curve and propagation of uncertainty
for exponents. The following data were obtained when a Ca2+
14-38.
Expert Solution
This question has been solved!
Explore an expertly crafted, step-by-step solution for a thorough understanding of key concepts.

This is a popular solution!

Trending now
This is a popular solution!

Step by step
Solved in 4 steps with 4 images

Recommended textbooks for you
Principles of Instrumental Analysis
Chemistry
ISBN:
9781305577213
Author:
Douglas A. Skoog, F. James Holler, Stanley R. Crouch
Publisher:
Cengage Learning


Chemistry & Chemical Reactivity
Chemistry
ISBN:
9781337399074
Author:
John C. Kotz, Paul M. Treichel, John Townsend, David Treichel
Publisher:
Cengage Learning
Principles of Instrumental Analysis
Chemistry
ISBN:
9781305577213
Author:
Douglas A. Skoog, F. James Holler, Stanley R. Crouch
Publisher:
Cengage Learning
Chemistry & Chemical Reactivity
Chemistry
ISBN:
9781337399074
Author:
John C. Kotz, Paul M. Treichel, John Townsend, David Treichel
Publisher:
Cengage Learning

Chemistry & Chemical Reactivity
Chemistry
ISBN:
9781133949640
Author:
John C. Kotz, Paul M. Treichel, John Townsend, David Treichel
Publisher:
Cengage Learning