JMP output appears below for simple linear regression with data from the price, y (in $1000), of n = 28 Seattle home prices. The explanatory variable is the total number of square feet in the home. - Response Price ($000) Regression Plot 600 500 400 300 200 - Distributions 1000 1500 2000 2500 3000 3500 Square Feet Square Feet Summary of Fit RSquare RSquare Adi Root Mean Square Error Mean of Response Observations (or Sum Wgts) 0.560503 0.543599 356.8214 28 Analysis of Variance Sum of 1000 1500 2000 2500 3000 3500 Source DF F Ratio Squares Mean Square 1 249200.64 Model 249201 33.1585 - Summary Statistics Error 26 Prob > F C. Total 27 <.0001 Mean 1923.1071 Std Dev 653.11574 v Parameter Estimates Std Er Mean 123.42727 Term Estimate Std Error t Ratio Prob>lt Upper 95% Mean 2176.359 Lower 95% Mean 1669.8553 Intercept Square Feet 0.1470966 0.025545 73.938964 51.78554 1.43 0.1653 5.76 <.0001 28 (ooos) eoad Does the following plots raise concerns about any of the assumptions associated with the re- gression model? Briefly explain why you may, or may not, be concerned about any assumptions addressed by those plots. * Residual by Predicted Plot 200 150 100 -50 -100 -150 -200 200 300 400 S00 600 Price S000 Predicted Residual Normal Quantile Plot 200 150 100 50 60 100 -150 200 Namal Quatile Price (So00) Residual erpey looosa
JMP output appears below for simple linear regression with data from the price, y (in $1000), of n = 28 Seattle home prices. The explanatory variable is the total number of square feet in the home. - Response Price ($000) Regression Plot 600 500 400 300 200 - Distributions 1000 1500 2000 2500 3000 3500 Square Feet Square Feet Summary of Fit RSquare RSquare Adi Root Mean Square Error Mean of Response Observations (or Sum Wgts) 0.560503 0.543599 356.8214 28 Analysis of Variance Sum of 1000 1500 2000 2500 3000 3500 Source DF F Ratio Squares Mean Square 1 249200.64 Model 249201 33.1585 - Summary Statistics Error 26 Prob > F C. Total 27 <.0001 Mean 1923.1071 Std Dev 653.11574 v Parameter Estimates Std Er Mean 123.42727 Term Estimate Std Error t Ratio Prob>lt Upper 95% Mean 2176.359 Lower 95% Mean 1669.8553 Intercept Square Feet 0.1470966 0.025545 73.938964 51.78554 1.43 0.1653 5.76 <.0001 28 (ooos) eoad Does the following plots raise concerns about any of the assumptions associated with the re- gression model? Briefly explain why you may, or may not, be concerned about any assumptions addressed by those plots. * Residual by Predicted Plot 200 150 100 -50 -100 -150 -200 200 300 400 S00 600 Price S000 Predicted Residual Normal Quantile Plot 200 150 100 50 60 100 -150 200 Namal Quatile Price (So00) Residual erpey looosa

Glencoe Algebra 1, Student Edition, 9780079039897, 0079039898, 2018
18th Edition
ISBN:9780079039897
Author:Carter
Publisher:Carter
Chapter4: Equations Of Linear Functions
Section4.6: Regression And Median-fit Lines
Problem 6PPS

Related questions
Topic Video
Question
See images for the introduction, as well as the question.
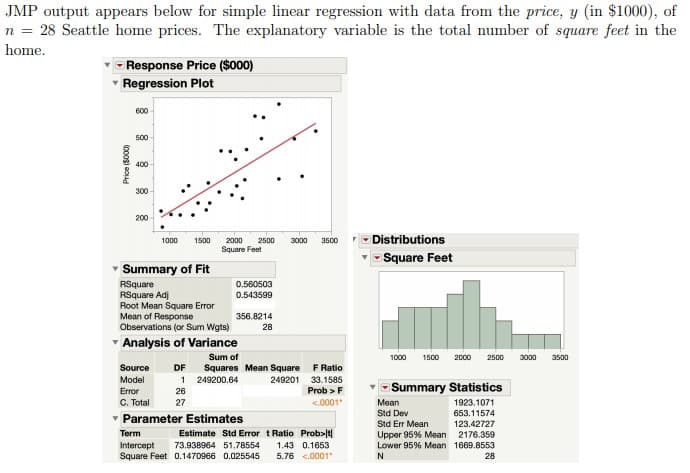
Transcribed Image Text:JMP output appears below for simple linear regression with data from the price, y (in $1000), of
n = 28 Seattle home prices. The explanatory variable is the total number of square feet in the
home.
- Response Price ($000)
Regression Plot
600
500
400
300
200
- Distributions
1000
1500
2000
2500
3000
3500
Square Feet
Square Feet
Summary of Fit
RSquare
RSquare Adi
Root Mean Square Error
Mean of Response
Observations (or Sum Wgts)
0.560503
0.543599
356.8214
28
Analysis of Variance
Sum of
1000
1500
2000
2500
3000
3500
Source
DF
F Ratio
Squares Mean Square
1 249200.64
Model
249201 33.1585
- Summary Statistics
Error
26
Prob > F
C. Total
27
<.0001
Mean
1923.1071
Std Dev
653.11574
v Parameter Estimates
Std Er Mean
123.42727
Term
Estimate Std Error t Ratio Prob>lt
Upper 95% Mean 2176.359
Lower 95% Mean 1669.8553
Intercept
Square Feet 0.1470966 0.025545
73.938964 51.78554
1.43 0.1653
5.76 <.0001
28
(ooos) eoad
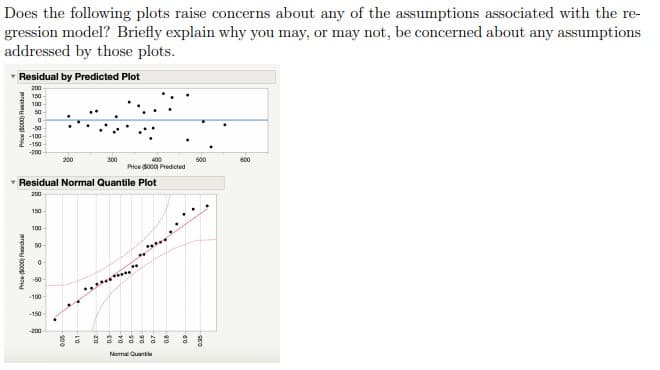
Transcribed Image Text:Does the following plots raise concerns about any of the assumptions associated with the re-
gression model? Briefly explain why you may, or may not, be concerned about any assumptions
addressed by those plots.
* Residual by Predicted Plot
200
150
100
-50
-100
-150
-200
200
300
400
S00
600
Price S000 Predicted
Residual Normal Quantile Plot
200
150
100
50
60
100
-150
200
Namal Quatile
Price (So00) Residual
erpey looosa
Expert Solution
This question has been solved!
Explore an expertly crafted, step-by-step solution for a thorough understanding of key concepts.

This is a popular solution!

Trending now
This is a popular solution!

Step by step
Solved in 2 steps

Knowledge Booster


Learn more about
Need a deep-dive on the concept behind this application? Look no further. Learn more about this topic, statistics and related others by exploring similar questions and additional content below.Recommended textbooks for you
Glencoe Algebra 1, Student Edition, 9780079039897…
Algebra
ISBN:
9780079039897
Author:
Carter
Publisher:
McGraw Hill

Algebra & Trigonometry with Analytic Geometry
Algebra
ISBN:
9781133382119
Author:
Swokowski
Publisher:
Cengage

Glencoe Algebra 1, Student Edition, 9780079039897…
Algebra
ISBN:
9780079039897
Author:
Carter
Publisher:
McGraw Hill
Algebra & Trigonometry with Analytic Geometry
Algebra
ISBN:
9781133382119
Author:
Swokowski
Publisher:
Cengage

Elementary Linear Algebra (MindTap Course List)
Algebra
ISBN:
9781305658004
Author:
Ron Larson
Publisher:
Cengage Learning

Functions and Change: A Modeling Approach to Coll…
Algebra
ISBN:
9781337111348
Author:
Bruce Crauder, Benny Evans, Alan Noell
Publisher:
Cengage Learning

Algebra and Trigonometry (MindTap Course List)
Algebra
ISBN:
9781305071742
Author:
James Stewart, Lothar Redlin, Saleem Watson
Publisher:
Cengage Learning