Men Women Mean Min Маx Mean Min Маx Ln(wages) 3.562 1.389 5.013 3.198 1.213 4.875 Black 0.231 1 0.191 1 Age Work experience Schooling Percent female in occupation 42.2 19 68 39.2 19 63. 18.1 42 16.1 35 13.9 9. 21 14.1 9. 21 0.182 0.023 .954 0.623 0.067 .985


Correlation
Correlation defines a relationship between two independent variables. It tells the degree to which variables move in relation to each other. When two sets of data are related to each other, there is a correlation between them.
Linear Correlation
A correlation is used to determine the relationships between numerical and categorical variables. In other words, it is an indicator of how things are connected to one another. The correlation analysis is the study of how variables are related.
Regression Analysis
Regression analysis is a statistical method in which it estimates the relationship between a dependent variable and one or more independent variable. In simple terms dependent variable is called as outcome variable and independent variable is called as predictors. Regression analysis is one of the methods to find the trends in data. The independent variable used in Regression analysis is named Predictor variable. It offers data of an associated dependent variable regarding a particular outcome.
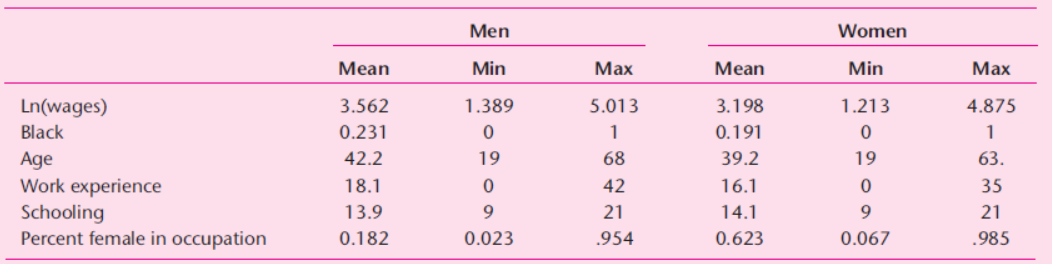
Consider a data set with the following
Wage is the worker’s hourly wage; Black takes on a value of 1 if the worker is black and a value of 0 otherwise; work experience is actual years of work experience; schooling is measured in years; and percent female in occupation is the percent of all employees in the worker’s occupation who are female. The following table reports the regression results from a log-wage regression.
| Men | Women | |
|
Constant Black Age Years of work experience Years of schooling Percent female in occupation Number of observations R-squared |
2.314 -0.198 0.054 0.042 0.085 -0.121 442 0.231 |
2.556 -0.154 0.037 0.059 0.083 0.002 278 0.254 |
Decompose the raw difference in average wages using the Oaxaca decomposition. Specifically, decompose the raw difference into the portion due to differences in personal characteristics (schooling, race, age, and experience), the portion due to occupation, and the portion left unexplained possibly due to gender discrimination.


Trending now
This is a popular solution!

Step by step
Solved in 3 steps with 5 images


