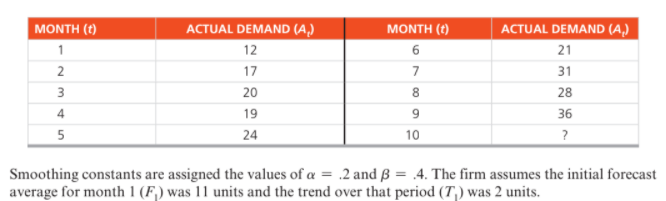
MONTH (t) ACTUAL DEMAND (A,) MONTH (t) ACTUAL DEMAND (A,) 1 12 6 21 17 7 31 3 20 8 28 4 19 9 36 5 24 10 Smoothing constants are assigned the values of a = .2 and ß = .4. The firm assumes the initial forecast average for month 1 (F) was 11 units and the trend over that period (T,) was 2 units.
Q: After plotting demand for four periods, an emergency room manager has concluded that a…
A: Given data is TAF for fifth period = 250
Q: Week Actual Forecast Demand 1 52 48 2 42 46 3 56 52 4 45 47 true or false Assume that the actual…
A: The table shows the calculation of forecast of demand using the simple moving average method with 3…
Q: The actual number of patients at Omaha Emergency Medical Clinic for the first sIX weeks of this year…
A: This problem can be solved using the weighted moving average method of forecasting.
Q: 1. Solve manually. The following gives the number of pints of type A blood used at Woodlawn Hospital…
A: Given-
Q: Handy, Inc., produces a solar-powered electronic calculator that has experiencedthe following…
A: Formula:
Q: The operations manager of a company extructed the following annual demand data from the research and…
A: Find the Given details below: Given Details: Quarters Demand 1 120 2 90 3 100 4 75 5…
Q: Given the following history, use a three-quarter moving average to forecast the demand for the third…
A: Solution Moving average considers the average of the past data. The average can be of three periods…
Q: Given the following demand data,a. Compute a weighted average forecast using a weight of .40 for the…
A: 4-period weighted average forecast: Formula: Answer:
Q: National Scan, Ic., sells radio frequency inventory tags. Monthly sales for a seven-month period…
A: Given data- Month Sales (000) units Feb 13 Mar 16 Apr 10 May 18 Jun 20 Jul 21 Aug…
Q: The number of internal disk drives (in millions) made at a plant in Taiwan during the past 5 years…
A: Find the Given details below: Given Details: Year Disk Drives 1 138 2 156 3 184 4 202…
Q: Given current demand in this period of 103, a forecast for this current period of 99, and an alpha…
A: Exponential smoothing is a forecasting model which helps to identify the forecasting value based on…
Q: Given the following history, use a three-quarter moving average to forecast the demand for the third…
A: Sum of the Last Quarter = 200+260+260 = 720 Sum of Second last quarter = 165+200+175 = 540 Sum of…
Q: Problem 4 - do both a three period moving average and an exponential smoothing forecast with an…
A: Forecasting is the process of predicting the future demand based on the previous data and demand.
Q: The average demand for January has been 80, and the average annual demandhas been 1800. Calculate…
A: Forecasting in operations management is a process by which predictions are made for the production.…
Q: Consider the following actual (A,) and forecast (F,) demand levels for a commercial multiline…
A: The forecast for period 5 can be computed as follows:
Q: A company has an unbiased forecast for its demand. What does that mean?a. All forecast errors are…
A: Forecasting is the procedure of prediction making for the future grounded on past as well as present…
Q: The Yummy Ice Cream Company uses the exponential smoothing method. Last week the forecast was…
A:
Q: Please show work
A: From the given data.
Q: The following table shows the actual demand observed over the last 11 years: Year 1 2 4 7 8 10 11…
A: Given - Table for demand seen in past years- Year Actual Demand 1 6 2 9 3 4 4 9 5 13…
Q: 45 & 46
A: Note: Answered the first question. Kindly post another question separatelyDetermine slope and…
Q: Use the least square method to make the forecasting table. Compute the MAE and MSE
A: Forecasting is a technique used to predict future outcomes on the basis of past data. In businesses…
Q: c) What is this year's forecast using exponential smoothing with alpha = 0.4, if year 2017's…
A: The concept of Operation Management: Operation management is the management that applies to a…
Q: The sales of XYZ company for the previous three perlods are 45, 42, and 43 respectively Entimate the…
A: Forecasting sales refers to the prediction of future sales using previous data to estimate the…
Q: Monthly sales in a company for a seven-period (Jan-July) were as follows: 19, 18, 16, 14, 17, 19,…
A: A simple moving average calculates the average of a selected range of the values, usually the closed…
Q: Consider the following actual (At) and forecast(Ft) demand levels for a commercial multiline…
A:
Q: Hint: Exponential Smoothing: The company has accumulated the demand data, shown below, for its…
A: Exponential smoothing- F(t+1) = αAt + (1-α)Ft α = 0.5
Q: A large Portland manufacturing would like to forecast the monthly demand for a piece of…
A: Given that: Month Actual Demand 1 14 2 17 3 20 4 21 5 25
Q: The forecast for the month of November was higher than the actual demand and the forecast for the…
A:
Q: B). Using exponential smoothing, calculate the forecasts for months 2, 3, 4, 5, and 6. The smoothing…
A: Find the Calculations below: Formulas:
Q: National Standard, Inc. sells radio frequency identification (RFID) tags. Monthly demand for a…
A: Note: - Since we only answer up to 3 sub-parts, we’ll answer the first3. Please resubmit the…
Q: Given the following data for demand at the XYZ Company, calculate the monthly forecast for 2003…
A: given,
Q: Period Demand 1 40 2 40 3…
A: Assessing strategy in which the last time frame's actuals are utilized as this present period's…
Q: Weekly demand for an item averaged 100 units over the past year. Actual demand forthe next eight…
A:
Q: Sales of tablet computers at Ted Glickman's electronicsstore in Washington, D.C., over the past 10…
A: Given data is
Q: c) If the forecasted demand for the week of August 31 is 345 and a = 0.20, using exponential…
A:
Q: a) Calculate the three-period moving-average forecast for periods 7 through 10. Three-period Period…
A: Given data is
Q: Sales of tablet computers at Ted Glickman’s electron-ics store in Washington, D.C., over the past 10…
A: Formula:
Q: 6. Consider the following data table. (12 Points) a) Forecast demand using exponential smoothing…
A: Error = Real demand - Forecast Absolute Error = Positive value of Error Error Square = square of…
Q: Use = 0.2 to compute the exponential smoothing values for the time series. Forecast for Month 8. The…
A: Given that , Forecast for 6 months is 21 The two month moving average for months two to five is…
Q: b. Using exponential smoothing with a = 0.40, if the exponential forecast for week 3 was estimated…
A: Exponential smoothing is a forecasting model which helps to identify forecasting value using the…
Q: If the demand in the current week was 102 units and we had forecast it to be 125, what would be next…
A: Exponential smoothing is a time series forecasting technique that forecasts data for a given period…
Q: Find forecasting error from the following table by using Tracking Signal. Period Actual…
A: n = 6
Q: In January a battery dealer pridicts February demand of 2000 2 charger battery whereas the actual…
A: Given- January Forecast demand Ft= 2000 units January Actual demand At= 1756 units Smoothing…
Q: As you can see in the following table, demand for heart transplant surgery at Washington General…
A: The concept used here is forecasting with the Exponential Smoothening method.
Q: Based on the information in the following table, use the Exponential Smoothing Approach (a = 0.3) to…
A: The question is related to the Exponential smoothing model. The Forecasted demand as per Exponential…
Q: The actual demand for the patients at EYE OPD of KTH for the first six weeks of this year follows…
A: Given data is
Q: The following gives the number of pints of type Bblood used a t Woodlawn Hospital in the past 6…
A: The formulas to be used are as follows: 3-week moving average= sum of previous 3 week pints/number…
Q: Not all the items in your office supply store are evenly distributed as far as demand is concerned,…
A: Given- Week Demand Week 1 250 Week 2 350 Week 3 550 Week 4 650
Q: If actual recent demand was 41.5, using the focus forecasting approach, the forecast technique to…
A: THE ANSWER IS AS BELOW:
A large Portland manufacturer wants to
review of past sales, as shown below, indicates that an increasing trend is present:
Trending now
This is a popular solution!
Step by step
Solved in 2 steps with 1 images
- The file P13_22.xlsx contains total monthly U.S. retail sales data. While holding out the final six months of observations for validation purposes, use the method of moving averages with a carefully chosen span to forecast U.S. retail sales in the next year. Comment on the performance of your model. What makes this time series more challenging to forecast?The Baker Company wants to develop a budget to predict how overhead costs vary with activity levels. Management is trying to decide whether direct labor hours (DLH) or units produced is the better measure of activity for the firm. Monthly data for the preceding 24 months appear in the file P13_40.xlsx. Use regression analysis to determine which measure, DLH or Units (or both), should be used for the budget. How would the regression equation be used to obtain the budget for the firms overhead costs?The file P13_02.xlsx contains five years of monthly data on sales (number of units sold) for a particular company. The company suspects that except for random noise, its sales are growing by a constant percentage each month and will continue to do so for at least the near future. a. Explain briefly whether the plot of the series visually supports the companys suspicion. b. By what percentage are sales increasing each month? c. What is the MAPE for the forecast model in part b? In words, what does it measure? Considering its magnitude, does the model seem to be doing a good job? d. In words, how does the model make forecasts for future months? Specifically, given the forecast value for the last month in the data set, what simple arithmetic could you use to obtain forecasts for the next few months?
- The file P13_42.xlsx contains monthly data on consumer revolving credit (in millions of dollars) through credit unions. a. Use these data to forecast consumer revolving credit through credit unions for the next 12 months. Do it in two ways. First, fit an exponential trend to the series. Second, use Holts method with optimized smoothing constants. b. Which of these two methods appears to provide the best forecasts? Answer by comparing their MAPE values.The file P13_19.xlsx contains the weekly sales of a particular brand of paper towels at a supermarket for a one-year period. a. Using a span of 3, forecast the sales of this product for the next 10 weeks with the moving averages method. How well does this method with span 3 forecast the known observations in this series? b. Repeat part a with a span of 10. c. Which of these two spans appears to be more appropriate? Justify your choice.The file P13_26.xlsx contains the monthly number of airline tickets sold by the CareFree Travel Agency. a. Create a time series chart of the data. Based on what you see, which of the exponential smoothing models do you think will provide the best forecasting model? Why? b. Use simple exponential smoothing to forecast these data, using a smoothing constant of 0.1. c. Repeat part b, but search for the smoothing constant that makes RMSE as small as possible. Does it make much of an improvement over the model in part b?
- The file P13_28.xlsx contains monthly retail sales of U.S. liquor stores. a. Is seasonality present in these data? If so, characterize the seasonality pattern. b. Use Winters method to forecast this series with smoothing constants = = 0.1 and = 0.3. Does the forecast series seem to track the seasonal pattern well? What are your forecasts for the next 12 months?The file P13_29.xlsx contains monthly time series data for total U.S. retail sales of building materials (which includes retail sales of building materials, hardware and garden supply stores, and mobile home dealers). a. Is seasonality present in these data? If so, characterize the seasonality pattern. b. Use Winters method to forecast this series with smoothing constants = = 0.1 and = 0.3. Does the forecast series seem to track the seasonal pattern well? What are your forecasts for the next 12 months?Suppose that a regional express delivery service company wants to estimate the cost of shipping a package (Y) as a function of cargo type, where cargo type includes the following possibilities: fragile, semifragile, and durable. Costs for 15 randomly chosen packages of approximately the same weight and same distance shipped, but of different cargo types, are provided in the file P13_16.xlsx. a. Estimate a regression equation using the given sample data, and interpret the estimated regression coefficients. b. According to the estimated regression equation, which cargo type is the most costly to ship? Which cargo type is the least costly to ship? c. How well does the estimated equation fit the given sample data? How might the fit be improved? d. Given the estimated regression equation, predict the cost of shipping a package with semifragile cargo.
- The file P13_21.xlsx contains the weekly sales of rakes at a hardware store for a two-year period. Use the moving averages method, with spans of your choice, to forecast sales for the next 30 weeks. Does this method appear to track sales well? If not, what might be the reason?The file P13_20.xlsx contains the monthly sales of iPod cases at an electronics store for a two-year period. Use the moving averages method, with spans of your choice, to forecast sales for the next six months. Does this method appear to track sales well? If not, what might be the reason?The owner of a restaurant in Bloomington, Indiana, has recorded sales data for the past 19 years. He has also recorded data on potentially relevant variables. The data are listed in the file P13_17.xlsx. a. Estimate a simple regression equation involving annual sales (the dependent variable) and the size of the population residing within 10 miles of the restaurant (the explanatory variable). Interpret R-square for this regression. b. Add another explanatory variableannual advertising expendituresto the regression equation in part a. Estimate and interpret this expanded equation. How does the R-square value for this multiple regression equation compare to that of the simple regression equation estimated in part a? Explain any difference between the two R-square values. How can you use the adjusted R-squares for a comparison of the two equations? c. Add one more explanatory variable to the multiple regression equation estimated in part b. In particular, estimate and interpret the coefficients of a multiple regression equation that includes the previous years advertising expenditure. How does the inclusion of this third explanatory variable affect the R-square, compared to the corresponding values for the equation of part b? Explain any changes in this value. What does the adjusted R-square for the new equation tell you?