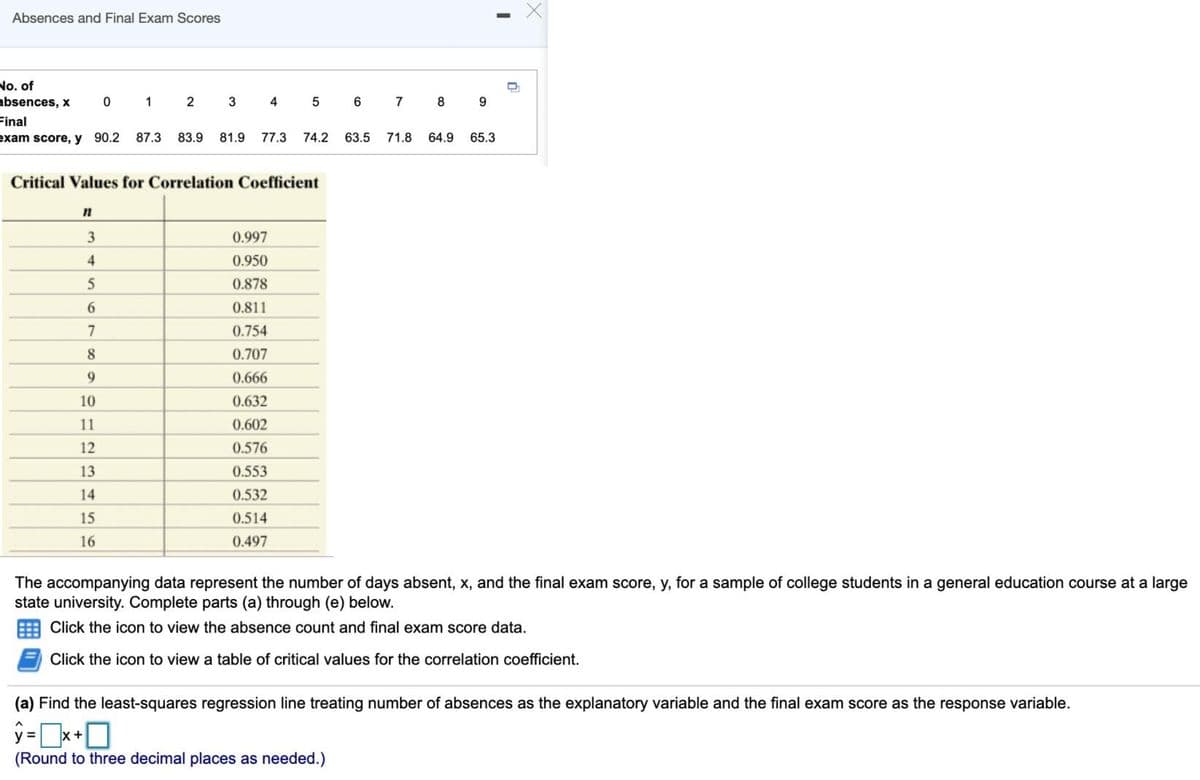
No. of absences, x Final exam score, y 90.2 87,3 1 3 4 6 7 8 9 83.9 81.9 77.3 74.2 63.5 71.8 64.9 65.3 Critical Values for Correlation Coefficient 3 0.997 4 0.950 5 0.878 0.811 7 0.754 0.707 9 0.666 10 0.632 11 0.602 12 0.576 13 0.553 14 0.532 15 0.514 16 0.497 The accompanying data represent the number of days absent, x, and the final exam score, y, for a sample of college students in a general education course at a large state university. Complete parts (a) through (e) below. E Click the icon to view the absence count and final exam score data. Click the icon to view a table of critical values for the correlation coefficient. (a) Find the least-squares regression line treating number of absences as the explanatory variable and the final exam score as the response variable. (Round to three decimal places as needed.)

Glencoe Algebra 1, Student Edition, 9780079039897, 0079039898, 2018
18th Edition
ISBN:9780079039897
Author:Carter
Publisher:Carter
Chapter4: Equations Of Linear Functions
Section4.5: Correlation And Causation
Problem 2BGP
icon
Related questions
Topic Video
Question

All the values are given 

Absences and Final Exam Scores
No. of
absences, x
Final
exam score, y 90.2
1
2
4
7
9.
87.3
83.9
81.9
77.3
74.2
63.5
71.8
64.9
65.3
Critical Values for Correlation Coefficient
3
0.997
4
0.950
0.878
6.
0.811
7
0.754
0.707
0.666
10
0.632
11
0.602
12
0.576
13
0.553
14
0.532
15
0.514
16
0.497
The accompanying data represent the number of days absent, x, and the final exam score, y, for a sample of college students in a general education course at a large
state university. Complete parts (a) through (e) below.
E Click the icon to view the absence count and final exam score data.
Click the icon to view a table of critical values for the correlation coefficient.
(a) Find the least-squares regression line treating number of absences as the explanatory variable and the final exam score as the response variable.
y =
(Round to three decimal places as needed.)
co
LO
3.
Transcribed Image Text:Absences and Final Exam Scores No. of absences, x Final exam score, y 90.2 1 2 4 7 9. 87.3 83.9 81.9 77.3 74.2 63.5 71.8 64.9 65.3 Critical Values for Correlation Coefficient 3 0.997 4 0.950 0.878 6. 0.811 7 0.754 0.707 0.666 10 0.632 11 0.602 12 0.576 13 0.553 14 0.532 15 0.514 16 0.497 The accompanying data represent the number of days absent, x, and the final exam score, y, for a sample of college students in a general education course at a large state university. Complete parts (a) through (e) below. E Click the icon to view the absence count and final exam score data. Click the icon to view a table of critical values for the correlation coefficient. (a) Find the least-squares regression line treating number of absences as the explanatory variable and the final exam score as the response variable. y = (Round to three decimal places as needed.) co LO 3.
Expert Solution
trending now

Trending now

This is a popular solution!

steps

Step by step

Solved in 2 steps with 2 images

Blurred answer
Knowledge Booster
Permutation and Combination
Learn more about
Need a deep-dive on the concept behind this application? Look no further. Learn more about this topic, statistics and related others by exploring similar questions and additional content below.
Recommended textbooks for you
Glencoe Algebra 1, Student Edition, 9780079039897…
Algebra
ISBN:
9780079039897
Author:
Carter
Publisher:
McGraw Hill
Algebra and Trigonometry (MindTap Course List)
Algebra
ISBN:
9781305071742
Author:
James Stewart, Lothar Redlin, Saleem Watson
Publisher:
Cengage Learning
Big Ideas Math A Bridge To Success Algebra 1: Stu…
Algebra
ISBN:
9781680331141
Author:
HOUGHTON MIFFLIN HARCOURT
Publisher:
Houghton Mifflin Harcourt