
Exploring Economics
8th Edition
ISBN: 9781544336329
Author: Robert L. Sexton
Publisher: SAGE Publications, Inc
expand_more
expand_more
format_list_bulleted
Related questions
Question
no handwriting notes
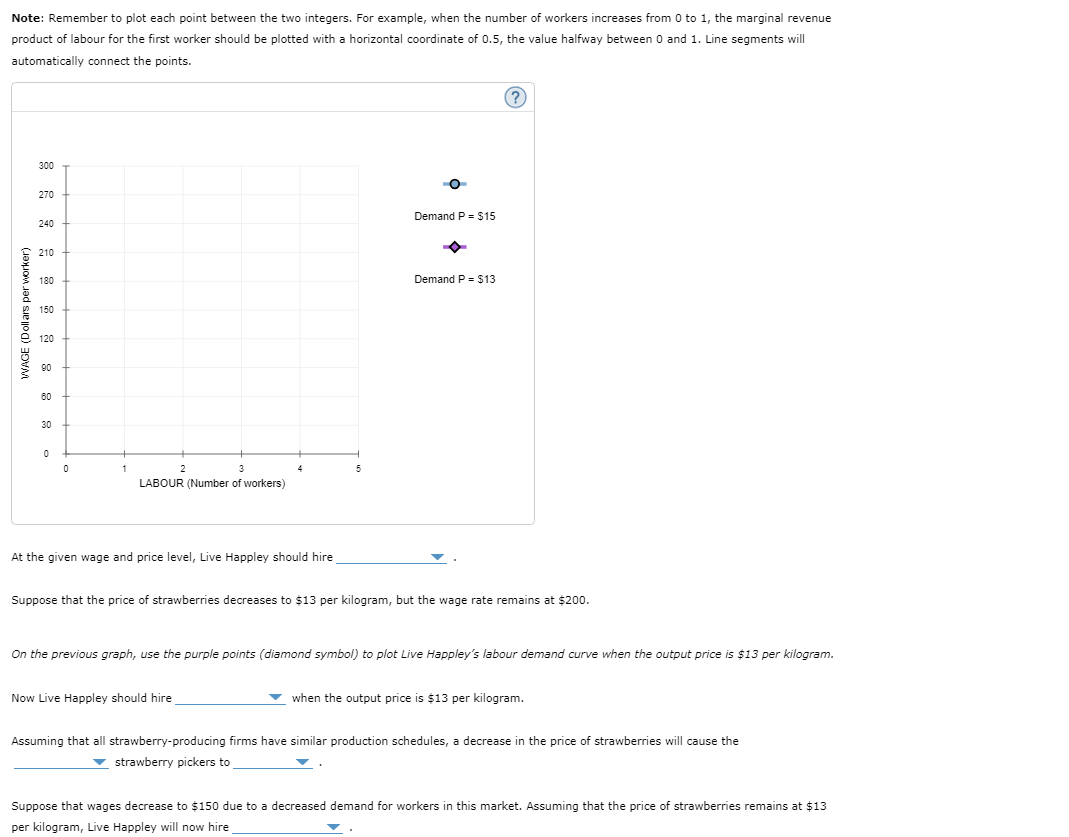

Transcribed Image Text:Note: Remember to plot each point between the two integers. For example, when the number of workers increases from 0 to 1, the marginal revenue
product of labour for the first worker should be plotted with a horizontal coordinate of 0.5, the value halfway between 0 and 1. Line segments will
automatically connect the points.
er worker)
WAGE (Dollars
300
270
240
210
180
150
120
90
60
30
0
0
1
3
LABOUR (Number of workers)
2
At the given wage and price level, Live Happley should hire
Demand P = $15
Now Live Happley should hire
Demand P = $13
?
Suppose that the price of strawberries decreases to $13 per kilogram, but the wage rate remains at $200.
On the previous graph, use the purple points (diamond symbol) to plot Live Happley's labour demand curve when the output price is $13 per kilogram.
▾ when the output price is $13 per kilogram.
Assuming that all strawberry-producing firms have similar production schedules, a decrease in the price of strawberries will cause the
strawberry pickers to
Suppose that wages decrease to $150 due to a decreased demand for workers in this market. Assuming that the price of strawberries remains at $13
per kilogram, Live Happley will now hire

Transcribed Image Text:Consider Live Happley Fields, a small player in the strawberry business whose production has no individual effect on wages and prices. Live Happley's
production schedule for strawberries is given in the following table:
Labour
Output
(Number of workers) (Kilograms of strawberries)
0
0
1
16
30
42
52
60
2
3
4
5
Suppose that the market wage for strawberry pickers is $200 per worker per day, and the price of strawberries is $15 per kilogram.
On the following graph, use the blue points (circle symbol) to plot Live Happley's labour demand curve when the output price is $15 per kilogram.
Note: Remember to plot each point between the two integers. For example, when the number of workers increases from 0 to 1, the marginal revenue
product of labour for the first worker should be plotted with a horizontal coordinate of 0.5, the value halfway between and 1. Line segments will
automatically connect the points.
Expert Solution
This question has been solved!
Explore an expertly crafted, step-by-step solution for a thorough understanding of key concepts.

Step by stepSolved in 3 steps with 2 images

Knowledge Booster


Learn more about
Need a deep-dive on the concept behind this application? Look no further. Learn more about this topic, economics and related others by exploring similar questions and additional content below.Similar questions
- What is the difference between a fixed input and a variable input?arrow_forwardAre there fixed costs in the lung-run? Explain briefly.arrow_forwardIf two painters can paint 200 square feet of wall in an hour, and three painters can paint 275 square feet, what is the marginal product of the third painter?arrow_forward
- Would you consider an interest payment on a loan to a film an explicit or implicit cost?arrow_forwardA common name for fixed cost is overhead. If you divide fixed cost by the quantity of output produced, you get average fixed cost. Supposed fixed cost is 1,000. What does the average fixed cost curve look like? Use your response to explain what spreading the overhead means.arrow_forwardWhat shapes would you generally expect a total product curve and a marginal product curve to have?arrow_forward
arrow_back_ios
arrow_forward_ios
Recommended textbooks for you
- Exploring EconomicsEconomicsISBN:9781544336329Author:Robert L. SextonPublisher:SAGE Publications, Inc
 Microeconomics: Private and Public Choice (MindTa...EconomicsISBN:9781305506893Author:James D. Gwartney, Richard L. Stroup, Russell S. Sobel, David A. MacphersonPublisher:Cengage Learning
 Economics: Private and Public Choice (MindTap Cou...EconomicsISBN:9781305506725Author:James D. Gwartney, Richard L. Stroup, Russell S. Sobel, David A. MacphersonPublisher:Cengage Learning


Exploring Economics
Economics
ISBN:9781544336329
Author:Robert L. Sexton
Publisher:SAGE Publications, Inc
Microeconomics: Private and Public Choice (MindTa...
Economics
ISBN:9781305506893
Author:James D. Gwartney, Richard L. Stroup, Russell S. Sobel, David A. Macpherson
Publisher:Cengage Learning
Economics: Private and Public Choice (MindTap Cou...
Economics
ISBN:9781305506725
Author:James D. Gwartney, Richard L. Stroup, Russell S. Sobel, David A. Macpherson
Publisher:Cengage Learning