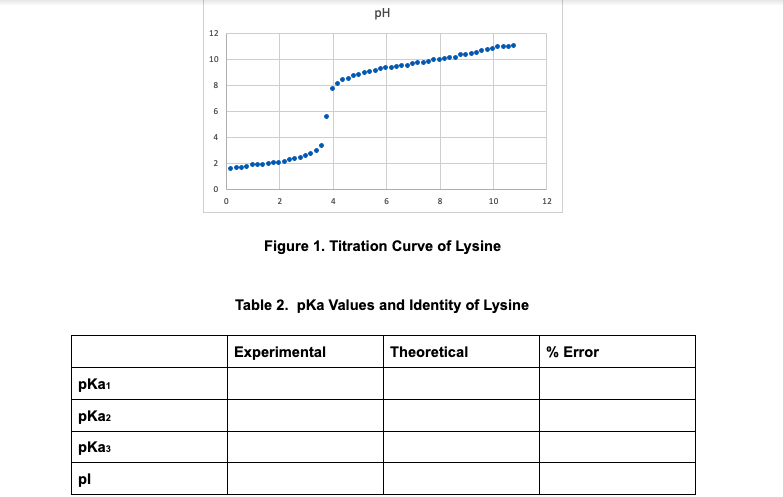
pH 12 10 10 12 Figure 1. Titration Curve of Lysine Table 2. pka Values and Identity of Lysine Experimental Theoretical % Error pKai pKa2 pKas pl


Q: 1. You want to purify a protein using anion exchange column chromatography. In this technique, the…
A: In anion exchange form of affinity column chromatography, since the solid state beads are…
Q: pSr value of a 50.00 mL solution of 0.01000 M Sr2+
A:
Q: Laboratory Activity- Assignment (Color Reaction of Proteins) 1. Provide the Principles and detailed…
A: # here I am explaining only Ninhydrin test . Please submit all this one by one in the portal.…
Q: Experiment No. 2 AMINO ACIDS AND PROTEINS Data Solubility in water Sample Solubility…
A: Disclaimer: "Since you have posted a question with multiple subparts, we will solve the first three…
Q: 39. The most expensive method to purify the protein is: Affinity Size exclusion RP-HPLC (reversed…
A: Proteins: Proteins are chemical substances that are made up of building blocks that are commonly…
Q: Mix 0.5 ml of cold saturated sulfanilic acid solution (HANDLE WITH CARE) with 0.25 ml of cold 1.0%…
A: Pauly's test is a biochemical test carried out to detect the presence of histidine and aromatic…
Q: Explain amino acids being amphoteric electrolytes to form peptide bonds. State at least 5 general…
A: Biuret test is also known as Piotrowskis’ test. This test is used to determine the presence of…
Q: Choosing the proper buffer solution In Protein Precipitation, two liters of 5mM buffer solution…
A: The processes that occur in the body require a specific and stable pH range. Buffers are solutions…
Q: 2 of 2 The student then conducts an experiment to determine the solubility of AgCl in a 2.5 M NaCl…
A:
Q: 1 TC: 200 250 300 350 Wavelength (nm) UV/Vis spectrum of four brands of polysorbate 80, a common…
A: Coomassie dye (Blue G-250; also refer as CBB) binds to protein and gives a colorimetric change in…
Q: Protein Isoelectric pH Molecular weight (kDa) Ovalbumin 4.6 45 Insulin 5.4 5.7 Fibrinogen 5.8 340…
A: The isoelectric point of a Protein: Isoelectric point is the pH at which a protein forms its…
Q: Graph of Absorbance vs Time(mins) 0.8 0.7 0.6 0.5 0.4 0.3 0.2 0.1 10 20 30 40 50 60 70 Time (mins) -…
A: Ampicillin is an antibiotic which inhibits the bacterial enzyme transpeptidase by binding to it…
Q: How do you solve these? Please explain
A: Hey, since there are multiple questions posted, we will answer first question. If you want any…
Q: A280/ A260 of 1.3. Estimate the pro 1. A solution of a purified protein yielded 0ontration of the…
A: Standard curves of purified reference proteins are used to determine the concentration of the…
Q: Question/ Calculate the pH and pOH of a 1.0 x 10⁷ solution HCI ?
A: The scale which is used to measure the acidic nature or basic nature of aqueous solutions is termed…
Q: S-CCT CCT C The protein assay kit that we will use to quantitate horseradish peroxidase requires…
A: Protien assay - It is the process of determining the amount or concentration of a specific protein…
Q: 8. In an experiment, the concentration of the pesticide Lindane (L) was determined by GC analysis by…
A: Given in the question : The peak area of lindane standard solution = 44000 (0.01 M) So, 44000 gives…
Q: 4. The conc of formaldehyde remaining after 360 mins was 15 mL from an initial volume of 2000 mL.…
A: In the first order reaction in which the rate of reaction is linearly dependent on one of the…
Q: D-fructose (MW 180.16) is a nonelectrolyte and does not dissociate. Its dissociation factor is 1.…
A: Fructose is a simple ketogenic simple sugar found in many plants where it is often bonded to glucose…
Q: The concentration of an unknown protein sample was determined as 2.3 mg/ml. Calculate the…
A: Molarity is defined as the number of moles of a solute present per liter of a solution.
Q: Size Size Crude Anion Cation 2) Exclusion Exclusion Lysate Exchange Exchange 1 2 Total Protein…
A: Enzymes are vital to life and constitute one of the human body's most significant protein groups. A…
Q: Rf Sample values A 0.21 В 0.39 C 0.33 0.27 Four amino acid samples were subjected to a normal-phase…
A: Normal phase chromatography is a type of adsorption chromatography which is used for analysis of…
Q: Consider the titration of 30.0 mL of 0.0700 M HONH2 (a weak base; Kb = 1.10e-08) with 0.100 M HI.…
A: pH is generally a measure of a solution is how acidic/basic water they are. The range normally…
Q: 80mL of a 0.3M solution of hexapeptide Leu-His-Cys-Glu-Asn-Arg is adjusted to pH=pI. The solution is…
A: Proteins are unbranched polymers constructed from 20 standard α-amino acids. They have four levels…
Q: Remember that DNA is a sequence of the letters A,C,T, and G. A binds with T and C binds with G.…
A: The Chargaff's rule of base pairing states that the purine Adenine (A) always pairs with the…
Q: 1. Why is oil liquid at room temperature, while butter is solid?
A: Fatty acids are the long-chain hydrocarbons with a carboxyl group. These are of two types; saturated…
Q: pSr value of a 50.00 mL solution of 0.01000 M Sr2+
A:
Q: ppose like :- At 10 am you received a doctors order that you have to Infuse 1,000ml of PNSS in 10…
A: I have answered below:
Q: Given this: Protein Isoelectric pH Molecular weight (kDa) Ovalbumin 4.6 45 Insulin 5.4 5.7…
A: The isoelectric point of a protein is the pH at which the net charge of the protein is zero. At this…
Q: C. Choosing the Proper Buffer Solution 1. Choosing the Proper Buffer Solution In Protein…
A: The processes that occur in the body require specific and stable pH range. Buffers are solutions…
Q: 6- 2- 1- 45 90 135 180 225 270 315 360 405 450 495 540 58! [Substrate] (nM) rate (nM/sec) is
A:
Q: Indicator Low pH color • Transition pH range • High pH color • blue-violet green Gentian violet…
A: Methyl orange = yellow; from reference table, color Red…<3.1-4.4<Yellow Methyl red = yellow;…
Q: Qualitative Analysis of Proteins 1. Fill out the table below by providing the necessary information…
A: Proteins are composed of amino acids, which are bound together by peptide linkage. Amino acids…
Q: Protein mixture contains four proteins alpl-4).blpl-6)l.clpl-9).dlpl+11). At pH-7, using cation…
A: Cation exchanger contain (-)ve charged stationary phase and (+)ve charged mobile phase. Hence,…
Q: Protein Isoelectric pH Molecular weight (kDa) Ovalbumin 4.6 45 Insulin 5.4 5.7 Fibrinogen 5.8 340…
A: The isoelectric point of a protein is the pH at which the net charge of the protein is zero. At this…
Q: Find the final concentration as a percent (w/v) of dextrose when 75 mL dextrose 50 % (w/v), 50 mL of…
A: There are different ways to denote the concentration of a solution. Per cent (w/v) means there is 1…
Q: Isotonicity. Show your complete solution. 1. A hospital pharmacist fills a medication order calling…
A: As per our policy, we are answering the first 3 questions only. Kindly repost for other questions.…
Q: 8. A solution containing a purified enzyme has a protein concentration of 0.1 mg/ml. What is the…
A: Protein, carbohydrates, and fats are biological macromolecules. Protein provides a structural…
Q: The molecular weight of a particular polymer should fall between 750 and 1,035. Thirty samples of…
A: The quality characteristic has a normal distribution with specification limits USL = 1035 and…
Q: 12. Observe and Reflect: Carefully compare sample 2 (BCG + albumin) to the blank after 50 min.…
A: Bromo Cresol Green (BCG ) is a diprotonic dye (ability to donate 2 H+) when the pH is at or above…
Q: Standard protein NaCl (ml) solution* (ml) 0 0.1 0.2 0.3 0.4 0.5 Table 1.... 898765 1.0 이이이이이 0.9 0.8…
A: Protein standard curve is used to determine the concentration of an unknown protein sample. It is…
Q: (24) Doctor. G ask you to prepare lidocaine 2mg per minute IV for a patient. You have a solution of…
A: Lidocaine is an amine anesthetic agent which is given to patients to prevent pain in operative…
Q: 7. You want to separate these four proteins in a mixture: Isoelectric point Mol. Weight (kDa)…
A: A Physical method for the separation of compounds is called chromatography. In two…
Q: 22-A. Consider a chromatography experiment in which two compo- nents with retention factors k = 4.00…
A: Chromatography is generally helped to separate components in a mixture and also helped to…
Q: 20. The dissociation constant of protein Z for ligand Y is: 10 micromolar. What fraction of the…
A: Given, The dissociation constant of protein Z for ligand Y is 10 micromolar That means (KD) = 10…
Q: 2b-i: When analyzing various substances in urine samples, the concentration of these is often the…
A: Here two different tests for urine are mentioned. The first question is asking about the Creatinine…
Please answer the pKa Values and Identity of Lysine

Step by step
Solved in 2 steps

How was the theoretical value of the pKa determined? In that given graph.
- After purifying the expressed protien His6-NEP of interest, the different fractions collected will be run on an SDS-Page gels. If our purification was successful a band of correct size should be present in: A) orginal lysate B) lysate flowthrough C) wash flowthrough D) Elute E) orginal lystae and elite fractions6. assay kits that determine the amount of glucose presentFour cosmid clones, which we will call cosmids A, B, C, and D, werehybridized to each other in pairwise combinations. The insert size ofeach cosmid was also analyzed. The following results were obtained:
- 1. How many TSS sites were identified using this technique? 2. Look at the labels next to each of the annotated TSSs. What are the labels for the TSS sites? 3. What is the coordinate for TSS_tra_16584216?8.Iron-uptake protein IupA is a human 302-aa, N-glycosylated, heterodimeric protein of considerable therapeutic interest. It contains 3 disulfide bridges that stabilise its structure. Explain what expression host you would use to produce the protein in recombinant form.complete steps of haworth projection of D-tagatose
- PLEASE MAKE THE DR BRUJIN GRAPH From these k-mers construct a de Bruijn graph and determine the sequence of the contig. AGCG ATCT ATGA ATGG ATTC CCCT CCTG CTCT CTGA CTGC CTTT GAAG GATT GCGT GCTC GTTC TATG TCAT TCTA TCTT TGAA TGAT TGGA TGTT TTCA TTCC TTTCFor each individual on gel, determine if the individual is homozygous for presence of the Alu insertion (++), heterozygous (+-), homozygous for the absence of the Alu insertion (- -), or if the results are inconclusive (I) (explain in detail what leads to your determination of each individual on the gel and why). Explain what may have caused any unexpected bands (neither 850 nor 550) lack of bands.1)De novo synthesis of nucleotides is an energy intensive process and therefore not always the primary source of nucleotides.Explain what is meant by this statement and how the process is regulated(specifically for urines)
- For each individual on each gel, determine if the individual is homozygous for presence of the Alu insertion(++), heterozygous (+-), homozygous for the absence of the Alu insertion (-), or if the results are inconclusive (I) (explain what makes you decide your determination, in detail). Explain what may have caused any unexpected bands (neither 850 nor 550) or lack of bands.Utilizing Bentham's "Felicific Calculus" step-by-step, give a justification in practicing proper use of facemasks outdoors as a health protocol during this time of COVID-19.A protein gives a single band on SDS gel electrophoresis, as shown inlanes 1 and 2 below. There is little, if any, effect from adding β-mercaptoethanol (BME) to the sample; if anything, the protein runs a little bitslower. When treated with the proteolytic enzyme thrombin and electrophoresis in the absence of BME, the protein migrates a bitmore rapidly (lane 3). But if BME is present, two much more rapidlymigrating bands are found (lane 4). Explain these results in terms of amodel for the protein.
