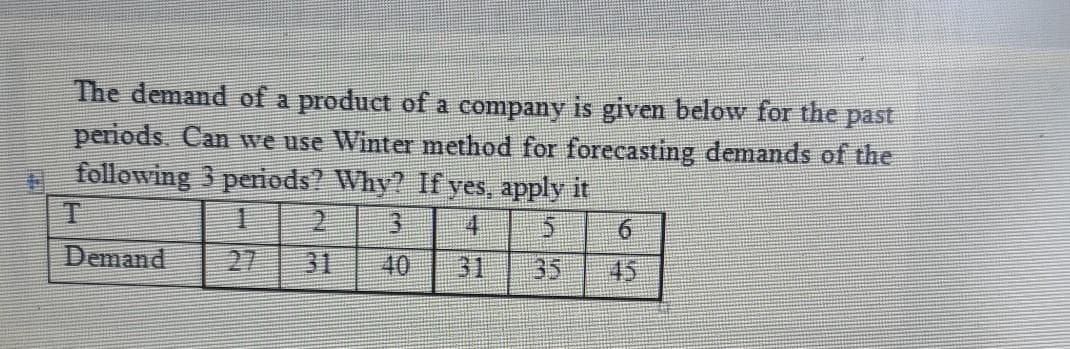
The demand of a product of a company is given below for the past periods. Can we use Winter method for forecasting demands of the H following 3 penods? Why? If yes, apply it 4 6. Demand 27 31 40 31 35 45
Q: Slope, b1 = MSE= c. What is the forecast for t = 8? If required, round your answer to three decimal…
A: *Answer: *b Here, the sample size is n = 7. Now, obtain the following table for necessary…
Q: The use of quarterly data to develop the forecasting model Yt = a +bYt-1 is an example of which…
A: The forecasting refers to the prediction technique for a certain situation taking into consideration…
Q: A bank predicts the total amount of deposits based on the Federal Reserve Prime Interest Rate. The…
A: R^2 is also called goodness of fit. It tells how well the regression model is fitted in the data…
Q: 1. DIHL CO.sa Danao-based logistcs company owned by Engr. Donaid H. Lalican. Antcipating the growing…
A: Find the Given details below:
Q: Consider the following demand data. Penod 2. 3. 4. 6. 6. 10 demand 130 452 428 470 478 Use Holt's…
A: The forecast can be calculated by the below formula: Ft+1= Dt+Dt-1+Dt-2/3 F = Forecast D = Demand F…
Q: A manager uses a trend equation plus quarterly relatives to predict demand. Quarter relatives are…
A: MAD=MEAN ABSOLUTE DEVIATION mean absolute deviation of a dataset is the average distance between…
Q: Use simple exponential smoothing with a = 0.6 to forecast the tire sales for September through…
A: Forecasting sales refers to the prediction of future sales using previous data to estimate the…
Q: Campus Advising needs to allocate time this week for office appointments, so she needs te forecast…
A: Economics is a branch of social science that describes and analyzes the behaviors and decisions…
Q: Lauren’s Beauty Boutique has experienced the followingweekly sales: Week Sales1 4322…
A: Given; Week Sales1 4322 3963 4154 4585 460
Q: lon 4 A potter makes and sells ceramic bowls. It is observed that when the price is $32, only 9…
A:
Q: According to the climate graph, what is the range of temperature recorded in the city of Yakutsk?…
A:
Q: The birthweight (in kg of 55 babies are tabulated in the frequency distribution below: Birthweight…
A: Birthweight (kg) Frequency Relative frequency (2-2.5) 11 11/55=0.2 Total n=55 Given:Total…
Q: is the world heading for a recession? explain the conditons under which the world can be classified…
A: Recession is an important phase of the business cycle. The recession is the movement from economic…
Q: Consider the following actual and forecast demandlevels for Big Mac hamburgers at a local McDonald’s…
A: The following formula will calculate the forecast for the big mac demand for Friday.
Q: Q1/ For the below frequency distribution table calculate all the below requiments. ;. 1- Relative…
A:
Q: Discuss how you would conduct sales forecasting when working with government aganecy. Be sure to…
A: Sales: It refers to the goods and services that have been available to the public for purchase. The…
Q: onential Smoothing with the following parameters: Ft+1=32 and the α = .15 Regression Months 1 2 3 4…
A: *Answer: . Forecasts are useful tools for making predictions and analyzing future outcomes.…
Q: The following information is for Questions 30-33: A firm's demand data from the last two quarters is…
A: Since you have posted a question with multiple sub-parts, we will solve the first three sub-parts…
Q: Refer to the following table. Second Event PL Total 41 S Click here for the Excel Data Fie a.…
A: The table lists the number of times the first event A and the second event B happens. The total…
Q: A police station had to deploy a police officer for an emergency multiple times in the last four…
A: Forecast for Friday using naive approach = Actual demand of previous period(Thursday) = 12.
Q: Question 4 Consider the following data: Month Bicycles Sold 21.6 2. 22.9 25.5 21.9 23.9 6. 27.5 7…
A: We are going to calculate Mean Absolute Percentage Error using its formula and definition.
Q: EXPLAIN 2 ways of how should the decision maker incorporate forecast error?
A: A forecast error is simply the difference between the actual and forecasted value of any time series…
Q: Director Very Busy needs to allocate time this week for office appointments, so he needs to forecast…
A: Economics is a branch of social science that describes and analyzes the behaviors and decisions…
Q: forecasts? 7. Contrast the use of MAD and MSE in evaluating forecasts. 8. What advantages as a…
A: 7. Introduction MAD (Mean Absolute Deviation) is a measure of variability which measures how far…
Q: Time Actual (Y) Forecast (Yhat) Forecast Error 100 110 115 120 ? If naïve method is used for the…
A: The forecasted value of time t is the actual value of time t-1. The forecast error is calculated by…
Q: Fiting a straght ne to a set of data yields he following prediction ine. Complete (a through ()…
A: Given Predicted line Yi⏞=4+7Xi⏞ .........(1)
Q: Sukject Economethic vasiable in com Discuss how dumr chomge slope and be used to test (a) intercept…
A: Dummy Variable A regression analysis is a mathematical parameter that is used to represent subsets…
Q: 13. Find the mean, mode, and median of the following sets of aaia. 82. 23, 59, 94, 70, 26, 32, 83,…
A: Hi! Thank you for the question, As per the honor code, we are allowed to answer one question at a…
Q: Next Stândard Period Error Forecasting Method Used Forecast (MSE) 1.3-period UnWMA 10.42 3.24…
A: Given:
Q: c. What would be this week's forecast for employee appointments using exponential smoothing with…
A: Economics is a branch of social science that describes and analyzes the behaviors and decisions…
Q: Define Forecasts and forecast errors in time series anaylsis?
A: Time series analysis is a technique in statistics that deals with trend analysis or time series…
Q: 4. Relate cycles, seasonality and trends in time series forecasting. What is their relevance in such…
A: Note:- Dear learner you have posted two questions, as per our policy we will solve only first…
Q: Direction: Complete the table below to find the 60th percentile for the following s of data. Find…
A: Given: Data set 1 Data set 2 Data set 3 20 49 18 22 50 19 25 55 20 32 55 22 35 60 25…
Q: Historical demand for the product is: Month Demand January 12 February 11 March 15 April 12 May 16…
A: Month Demand Weights Weighted average April 12 0.1 12*0.1 =1.2 May 16 0.3 16*0.3=4.8 June…
Q: Consider the following time series data. Year Value 1 234 2 287 255 4 310 5 298 250 7 456 8 412 9.…
A: The forecast is the process in which economists use historical data to estimate the direction of…
Q: Suppose we have the following time series data on variable Y (where t = trend): t Y 1 100 2 120 3…
A: Given: t y (At) 1 100 2 120 3 160 4 200 α=0.5
Q: Assume the following AR(1) Y, = 0.036 + 0.69Y,-1 + E Suppose you have data for t-1, let's say Y,I =…
A: * SOLUTION :- *(8)
Q: 2 6. 13 20 Yi 7 18 9 26 23 a. Which of the following scatter diagrams accurately represents the…
A: Answers (A) Option 'b' is correct i.e.,
Q: Director Very Busy needs to allocate time this week for office appointments, so he needs to forecast…
A: Economics is a branch of social science that describes and analyzes the behaviors and decisions…
Q: According to the climate graph, what is the range of temperature recorded in the city of Yakutsk?…
A:
Q: (a) Specify a model for housing starts that accounts for possible trends and seasonalit in the…
A: DISCLAIMER “Since you have asked multiple question, we will solve the first three question for you…
Q: d. If the director used these 4 weeks of data to create a linear regression, what does that linear…
A:
Q: 4. An electrical contractor's records during the last five weeks indicate the number of job…
A: * SOLUTION :- (4) Given that ,
Q: b. Is the World heading for a recession? Explain the conditions under which the world can be…
A: The economic cycle is being characterized by the four phases namely expansion, peak, contraction and…
Q: Based on the information in the following table, use the Exponential Smoothing Approach (a =0.5) to…
A: Use the below formula: Ft+1=αDt + 1 + αFt Ft+1=forecast for next period Dt=actual demand for…
Q: Solve for x for the following equation: 4ln(3x-8) = 60
A: Answer: Given, 4ln3x-8=60 4ln3x-84=604ln3x-8=153x-8=e153x=e15+8x=e15+83Let us substitute the value…
Q: From the following data relating to the number of letters posted a port office find the seasonal…
A: In the mentioned question we have to calculate seasonal variations using the method of simple…
Q: 6-5 Given: Consider the following time series data. week 1 2 3 4 5…
A: Forecast values are the estimated value for the future period based on the past trend. Forecast…
Step by step
Solved in 3 steps
- Consider the following time series data: Month 1 2 3 4 5 6 7 Value 24 13 20 12 19 23 15 Compute MSE using the most recent value as the forecast for the next period. What is the forecast for month 8? Compute MSE using the average of all the data available as the forecast for the next period. What is the forecast for month 8? Which method appears to provide the better forecast?Based on annual data from 2000-2010, the Gadget Company estimates that sales are growing according to a linear trend: Q = 50,000 + 200t where t is time and t = 0 in 2000. a. Forecast sales for 2013. b. Do you see any problems with this forecasting method?Define Forecasts and forecast errors in time series anaylsis?
- Historical demand for Peeps is as displayed in the table. Month Demand January 11 February 18 March 31 April 39 May 44 June 53 July 67 August 82 September 96 Develop forecasts from June through October using these techniques: Holt's method with alpha=0.2 and beta=0.1. For Holt's model, the level and trend for May are assumed to be 44 and 12. Judge which forecast method is the best based on MAD.A researcher has a sample of 6 annual observations {94, 104, 102, 99, 111 and 107} for the CPI in country Z for the period 2015 to 2020, and wants to forecast CPI for the years 2021, 2022 and 2023. The researcher uses 3 different forecasting models: A, B and C. Model A is an AR(1) model with no drift and with an estimated autoregressive coefficient = 0.7. Model B is a MA(1) model with no constant and with an estimated MA coefficient = -0.4 (note the minus !). Model C is a random walk model with no drift. The error terms over the 2015-2020 period were estimated to have the values: {3, -1, 2, 4, -3, 1}. a. Compute the 2021, 2022 and 2023 forecasted values for the consumer price index based on the three models. Show the formulas and the details of your calculations, and explain all the related symbols. b. Suppose that the actual values of the CPI over the 2021, 2022 and 2023 were {108, 114, 105}. Calculate the Root mean square error of the three model forecasts over the 2021-2023…Can you explain what these two belows mean in regard of GMM and Maximum likelihood. What are we calculating and what is it used to Unconstrained optimizationConstrained optimizatio
- (Ch7) If the mean time between in-flight aircraft engine shutdowns is 12,500 operating hours, what is the 90 percentile on the distribution of the number of hours until the next shutdown? (hint: convert the mean time between events to the mean events per hour λ, then apply inverse exponential) Question 7Select one: a. 20,180 hours b. 18,724 hours c. 23,733 hours d. 28,782 hours5 True/False/uncertain 7) With all observations in the same cluster, RSQ = 1. 8) With 500 multiple imputation samples generating 500 predictions of 0 or 1 for the binary dependent variable for each observation, to combine the 500 predictions into one for each observation, one has to take the mean of all 500 predictions and use a cutoff of 50%.(Ch7) True or False? We should use a normal distribution to model the number of years until the next Florida hurricane strike.