1. Ali required to use inductive coupled plasma mass spectroscopy (ICP-MS) to analyze amount of copper ion in wastewater samples. The following table shows the result of cop concentration from two different sample preparation methods. Concentration (mg/L) Sample Method A Method B Difference 1 0.39 0.36 0.04 2 1.35 0.84 0.51 2.56 1.76 0.8 4 3.92 3.35 0.57 5.35 4.69 0.66 9.33 7.7 1.63 7 10.70 10.52 0.18 8 10.92 10.81 0.11 a) What type of t test should be used to compare the two methods? Explain. b) Does the following result confirm a difference in the two methods at the 95% confiden level? Test the appropriate hypotheses. 3. 5,
1. Ali required to use inductive coupled plasma mass spectroscopy (ICP-MS) to analyze amount of copper ion in wastewater samples. The following table shows the result of cop concentration from two different sample preparation methods. Concentration (mg/L) Sample Method A Method B Difference 1 0.39 0.36 0.04 2 1.35 0.84 0.51 2.56 1.76 0.8 4 3.92 3.35 0.57 5.35 4.69 0.66 9.33 7.7 1.63 7 10.70 10.52 0.18 8 10.92 10.81 0.11 a) What type of t test should be used to compare the two methods? Explain. b) Does the following result confirm a difference in the two methods at the 95% confiden level? Test the appropriate hypotheses. 3. 5,

MATLAB: An Introduction with Applications
6th Edition
ISBN:9781119256830
Author:Amos Gilat
Publisher:Amos Gilat
Chapter1: Starting With Matlab
Section: Chapter Questions
Problem 1P

Related questions
Question
asap please urgently required.
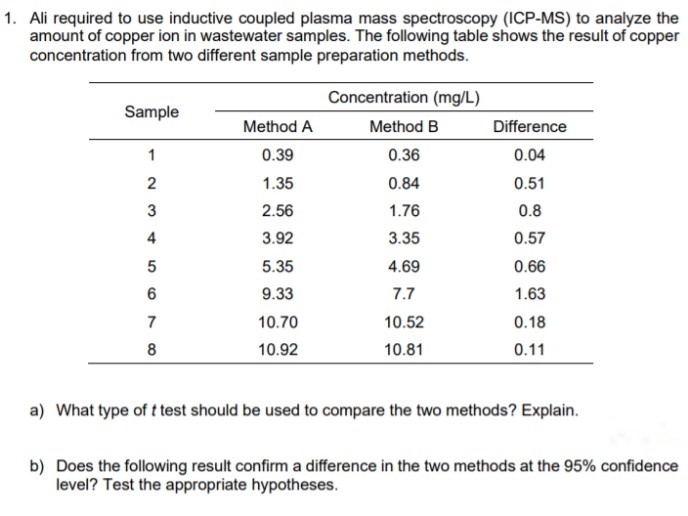
Transcribed Image Text:1. Ali required to use inductive coupled plasma mass spectroscopy (1CP-MS) to analyze the
amount of copper ion in wastewater samples. The following table shows the result of copper
concentration from two different sample preparation methods.
Concentration (mg/L)
Sample
Method A
Method B
Difference
1
0.39
0.36
0.04
2
1.35
0.84
0.51
2.56
1.76
0.8
4
3.92
3.35
0.57
5
5.35
4.69
0.66
9.33
7.7
1.63
7
10.70
10.52
0.18
8
10.92
10.81
0.11
a) What type of t test should be used to compare the two methods? Explain.
b) Does the following result confirm a difference in the two methods at the 95% confidence
level? Test the appropriate hypotheses.
Expert Solution
This question has been solved!
Explore an expertly crafted, step-by-step solution for a thorough understanding of key concepts.

Step by step
Solved in 5 steps with 2 images

Recommended textbooks for you
MATLAB: An Introduction with Applications
Statistics
ISBN:
9781119256830
Author:
Amos Gilat
Publisher:
John Wiley & Sons Inc

Probability and Statistics for Engineering and th…
Statistics
ISBN:
9781305251809
Author:
Jay L. Devore
Publisher:
Cengage Learning

Statistics for The Behavioral Sciences (MindTap C…
Statistics
ISBN:
9781305504912
Author:
Frederick J Gravetter, Larry B. Wallnau
Publisher:
Cengage Learning
MATLAB: An Introduction with Applications
Statistics
ISBN:
9781119256830
Author:
Amos Gilat
Publisher:
John Wiley & Sons Inc
Probability and Statistics for Engineering and th…
Statistics
ISBN:
9781305251809
Author:
Jay L. Devore
Publisher:
Cengage Learning
Statistics for The Behavioral Sciences (MindTap C…
Statistics
ISBN:
9781305504912
Author:
Frederick J Gravetter, Larry B. Wallnau
Publisher:
Cengage Learning

Elementary Statistics: Picturing the World (7th E…
Statistics
ISBN:
9780134683416
Author:
Ron Larson, Betsy Farber
Publisher:
PEARSON

The Basic Practice of Statistics
Statistics
ISBN:
9781319042578
Author:
David S. Moore, William I. Notz, Michael A. Fligner
Publisher:
W. H. Freeman

Introduction to the Practice of Statistics
Statistics
ISBN:
9781319013387
Author:
David S. Moore, George P. McCabe, Bruce A. Craig
Publisher:
W. H. Freeman