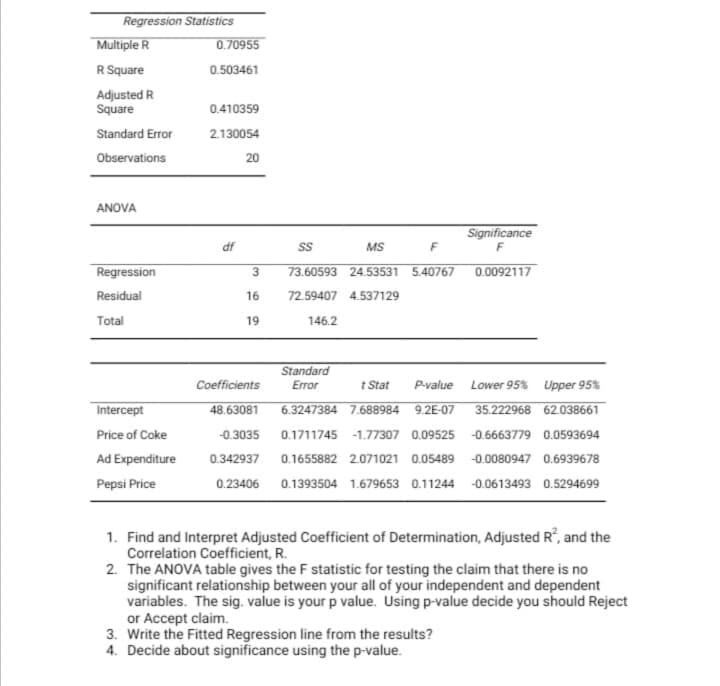
Regression Statistics Multiple R R Square 0.70955 0.503461 Adjusted R Square 0.410359 Standard Error 2.130054 Observations 20 ANOVA Significance df MS F Regression 3. 73.60593 24.53531 5.40767 0.0092117 Residual 16 72.59407 4.537129 Total 19 146.2 Standard Error Coefficients t Stat Pvalue Lower 95% Upper 95% Intercept 48.63081 6.3247384 7.688984 9.2E-07 35.222968 62.038661 Price of Coke 0.3035 0.1711745 -1.77307 0.09525 -0.6663779 0.0593694 Ad Expenditure 0.342937 0.1655882 2.071021 0.05489 -0.0080947 0.6939678 Pepsi Price 0.23406 0.1393504 1.679653 0.11244 -0.0613493 0.5294699 1. Find and Interpret Adjusted Coefficient of Determination, Adjusted R', and the Correlation Coefficient, R. 2. The ANOVA table gives the F statistic for testing the claim that there is no significant relationship between your all of your independent and dependent variables. The sig. value is your p value. Using p-value decide you should Reject or Accept claim. 3. Write the Fitted Regression line from the results? 4. Decide about significance using the p-value.

Functions and Change: A Modeling Approach to College Algebra (MindTap Course List)
6th Edition
ISBN:9781337111348
Author:Bruce Crauder, Benny Evans, Alan Noell
Publisher:Bruce Crauder, Benny Evans, Alan Noell
Chapter3: Straight Lines And Linear Functions
Section3.3: Modeling Data With Linear Functions
Problem 12E: Further Verification of Newtons Second LawThis exercise represents a hypothetical implementation of...
icon
Related questions
icon
Concept explainers
Question
Regression Statistics
Multiple R
0.70955
R Square
0.503461
Adjusted R
Square
0.410359
Standard Error
2.130054
Observations
20
ANOVA
Significance
df
MS
Regression
73.60593 24.53531 5.40767
0.0092117
Residual
16
72.59407 4.537129
Total
19
146.2
Standard
Coefficients
Error
t Stat
P-value
Lower 95% Upper 95%
Intercept
48.63081
6.3247384 7.688984 9.2E-07
35.222968 62.038661
Price of Coke
-0.3035
0.1711745
-1.77307 0.09525
-0.6663779 0.0593694
Ad Expenditure
0.342937
0.1655882 2.071021 0.05489 -0.0080947 0.6939678
Pepsi Price
0.23406 0.1393504 1.679653 0.11244 -0.0613493 0.5294699
1. Find and Interpret Adjusted Coefficient of Determination, Adjusted R°, and the
Correlation Coefficient, R.
2. The ANOVA table gives the F statistic for testing the claim that there is no
significant relationship between your all of your independent and dependent
variables. The sig. value is your p value. Using p-value decide you should Reject
or Accept claim.
3. Write the Fitted Regression line from the results?
4. Decide about significance using the p-value.
Transcribed Image Text:Regression Statistics Multiple R 0.70955 R Square 0.503461 Adjusted R Square 0.410359 Standard Error 2.130054 Observations 20 ANOVA Significance df MS Regression 73.60593 24.53531 5.40767 0.0092117 Residual 16 72.59407 4.537129 Total 19 146.2 Standard Coefficients Error t Stat P-value Lower 95% Upper 95% Intercept 48.63081 6.3247384 7.688984 9.2E-07 35.222968 62.038661 Price of Coke -0.3035 0.1711745 -1.77307 0.09525 -0.6663779 0.0593694 Ad Expenditure 0.342937 0.1655882 2.071021 0.05489 -0.0080947 0.6939678 Pepsi Price 0.23406 0.1393504 1.679653 0.11244 -0.0613493 0.5294699 1. Find and Interpret Adjusted Coefficient of Determination, Adjusted R°, and the Correlation Coefficient, R. 2. The ANOVA table gives the F statistic for testing the claim that there is no significant relationship between your all of your independent and dependent variables. The sig. value is your p value. Using p-value decide you should Reject or Accept claim. 3. Write the Fitted Regression line from the results? 4. Decide about significance using the p-value.
Expert Solution
trending now

Trending now

This is a popular solution!

steps

Step by step

Solved in 4 steps

Blurred answer
Knowledge Booster
Correlation, Regression, and Association
Learn more about
Need a deep-dive on the concept behind this application? Look no further. Learn more about this topic, statistics and related others by exploring similar questions and additional content below.
Similar questions
Recommended textbooks for you
Functions and Change: A Modeling Approach to Coll…
Algebra
ISBN:
9781337111348
Author:
Bruce Crauder, Benny Evans, Alan Noell
Publisher:
Cengage Learning
Algebra and Trigonometry (MindTap Course List)
Algebra
ISBN:
9781305071742
Author:
James Stewart, Lothar Redlin, Saleem Watson
Publisher:
Cengage Learning
College Algebra
College Algebra
Algebra
ISBN:
9781305115545
Author:
James Stewart, Lothar Redlin, Saleem Watson
Publisher:
Cengage Learning
Algebra & Trigonometry with Analytic Geometry
Algebra
ISBN:
9781133382119
Author:
Swokowski
Publisher:
Cengage
College Algebra
College Algebra
Algebra
ISBN:
9781337282291
Author:
Ron Larson
Publisher:
Cengage Learning
Glencoe Algebra 1, Student Edition, 9780079039897…
Algebra
ISBN:
9780079039897
Author:
Carter
Publisher:
McGraw Hill