Scenario 1: Individual Retirement Accounts (IRAS) allow people to shelter some of their income from taxation. Suppose the maximum annual contribution to such accounts is $5,000 per person. Now suppose there is a decrease in the maximum contribution, from $5,000 to $3,000 per year. Shift the appropriate curve on the graph to reflect this change. This change in the tax treatment of interest income from saving causes the equilibrium interest rate in the market for loanable funds to and the level of investment spending to Scenario 2: An investment tax credit effectively lowers the tax bill of any firm that purchases new capital in the relevant time period. Suppose the government repeals a previously existing investment tax credit. Shift the appropriate curve on the graph to reflect this change. The repeal of the previously existing tax credit causes the interest rate to v and the level of investment to Scenario 3: Initially, the government's budget is balanced; then the government significantly increases spending on national defense without changing taxes. This change in spending causes the government to run a budget which national saving. Shift the appropriate curve on the graph to reflect this change. This causes the interest rate to the level of investment spending.
Scenario 1: Individual Retirement Accounts (IRAS) allow people to shelter some of their income from taxation. Suppose the maximum annual contribution to such accounts is $5,000 per person. Now suppose there is a decrease in the maximum contribution, from $5,000 to $3,000 per year. Shift the appropriate curve on the graph to reflect this change. This change in the tax treatment of interest income from saving causes the equilibrium interest rate in the market for loanable funds to and the level of investment spending to Scenario 2: An investment tax credit effectively lowers the tax bill of any firm that purchases new capital in the relevant time period. Suppose the government repeals a previously existing investment tax credit. Shift the appropriate curve on the graph to reflect this change. The repeal of the previously existing tax credit causes the interest rate to v and the level of investment to Scenario 3: Initially, the government's budget is balanced; then the government significantly increases spending on national defense without changing taxes. This change in spending causes the government to run a budget which national saving. Shift the appropriate curve on the graph to reflect this change. This causes the interest rate to the level of investment spending.

Chapter16: Interest, Rent, And Profit
Section: Chapter Questions
Problem 3QP

Related questions
Question
100%
I need help in solving this problem.
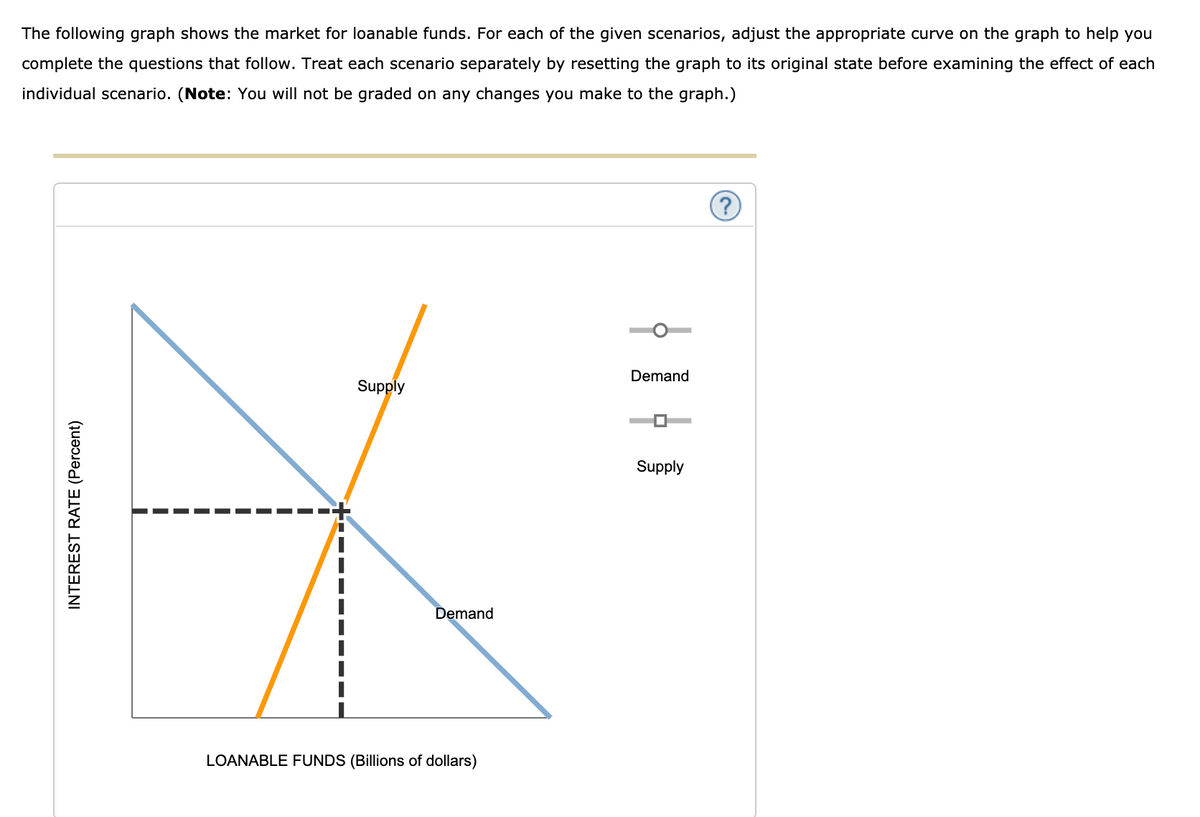
Transcribed Image Text:The following graph shows the market for loanable funds. For each of the given scenarios, adjust the appropriate curve on the graph to help you
complete the questions that follow. Treat each scenario separately by resetting the graph to its original state before examining the effect of each
individual scenario. (Note: You will not be graded on any changes you make to the graph.)
Demand
Supply
Supply
Demand
LOANABLE FUNDS (Billions of dollars)
INTEREST RATE (Percent)
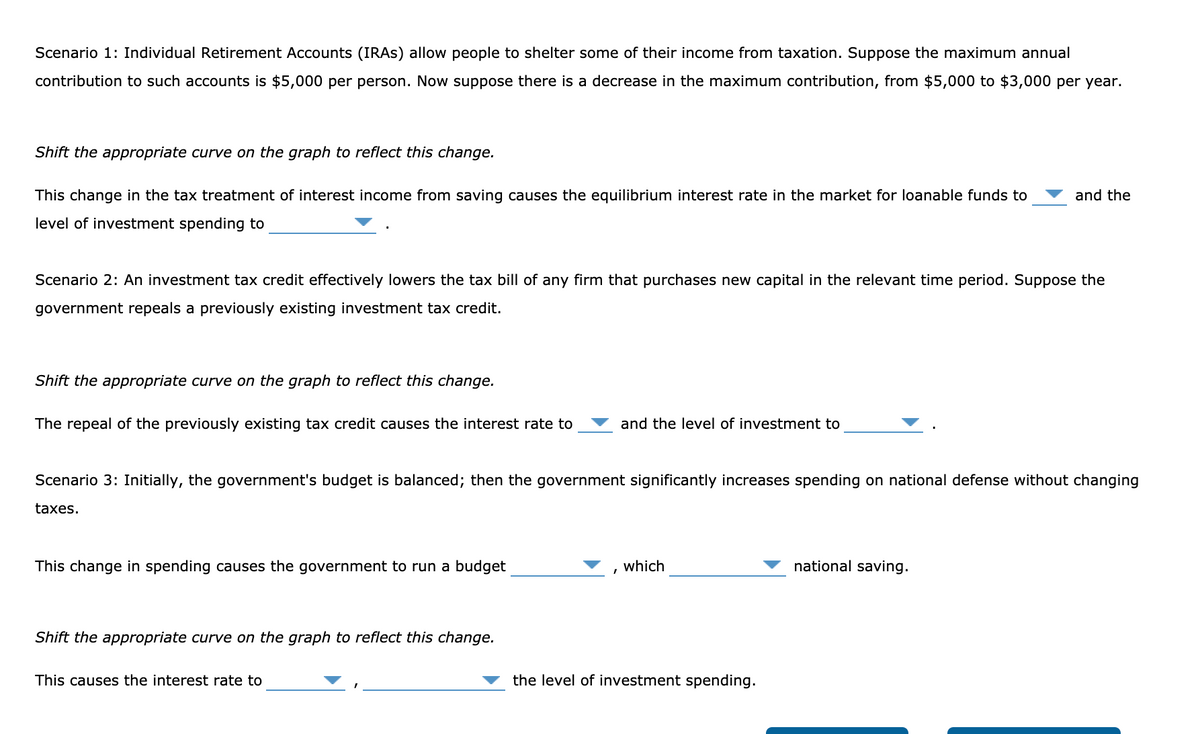
Transcribed Image Text:Scenario 1: Individual Retirement Accounts (IRAS) allow people to shelter some of their income from taxation. Suppose the maximum annual
contribution to such accounts is $5,000 per person. Now suppose there is a decrease in the maximum contribution, from $5,000 to $3,000 per year.
Shift the appropriate curve on the graph to reflect this change.
This change in the tax treatment of interest income from saving causes the equilibrium interest rate in the market for loanable funds to
and the
level of investment spending to
Scenario 2: An investment tax credit effectively lowers the tax bill of any firm that purchases new capital in the relevant time period. Suppose the
government repeals a previously existing investment tax credit.
Shift the appropriate curve on the graph to reflect this change.
The repeal of the previously existing tax credit causes the interest rate to
and the level of investment to
Scenario 3: Initially, the government's budget is balanced; then the government significantly increases spending on national defense without changing
taxes.
This change in spending causes the government to run a budget
which
national saving.
Shift the appropriate curve on the graph to reflect this change.
This causes the interest rate to
the level of investment spending.
Expert Solution
This question has been solved!
Explore an expertly crafted, step-by-step solution for a thorough understanding of key concepts.

This is a popular solution!

Trending now
This is a popular solution!

Step by step
Solved in 2 steps with 3 images

Knowledge Booster


Learn more about
Need a deep-dive on the concept behind this application? Look no further. Learn more about this topic, economics and related others by exploring similar questions and additional content below.Recommended textbooks for you

Economics (MindTap Course List)
Economics
ISBN:
9781337617383
Author:
Roger A. Arnold
Publisher:
Cengage Learning

Economics (MindTap Course List)
Economics
ISBN:
9781337617383
Author:
Roger A. Arnold
Publisher:
Cengage Learning


