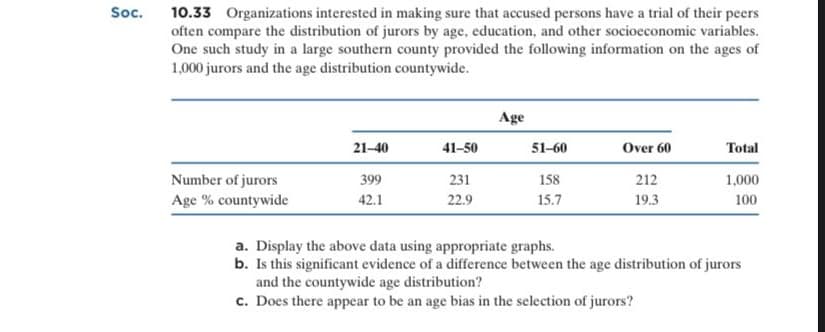
Soc. 10.33 Organizations interested in making sure that accused persons have a trial of their peers often compare the distribution of jurors by age, education, and other socioeconomic variables. One such study in a large southern county provided the following information on the ages of 1,000 jurors and the age distribution countywide. Age 21-40 41-50 51-60 Over 60 Total Number of jurors Age % countywide 399 231 158 212 1,000 42.1 22.9 15.7 19.3 100
Soc. 10.33 Organizations interested in making sure that accused persons have a trial of their peers often compare the distribution of jurors by age, education, and other socioeconomic variables. One such study in a large southern county provided the following information on the ages of 1,000 jurors and the age distribution countywide. Age 21-40 41-50 51-60 Over 60 Total Number of jurors Age % countywide 399 231 158 212 1,000 42.1 22.9 15.7 19.3 100

MATLAB: An Introduction with Applications
6th Edition
ISBN:9781119256830
Author:Amos Gilat
Publisher:Amos Gilat
Chapter1: Starting With Matlab
Section: Chapter Questions
Problem 1P

Related questions
Question
i need MCQ solution
Transcribed Image Text:10.33 Organizations interested in making sure that accused persons have a trial of their peers
often compare the distribution of jurors by age, education, and other socioeconomic variables.
One such study in a large southern county provided the following information on the ages of
1,000 jurors and the age distribution countywide.
Soc.
Age
21-40
41-50
51-60
Over 60
Total
399
212
Number of jurors
Age % countywide
231
158
1,000
42.1
22.9
15.7
19.3
100
a. Display the above data using appropriate graphs.
b. Is this significant evidence of a difference between the age distribution of jurors
and the countywide age distribution?
c. Does there appear to be an age bias in the selection of jurors?
Transcribed Image Text:Question 3
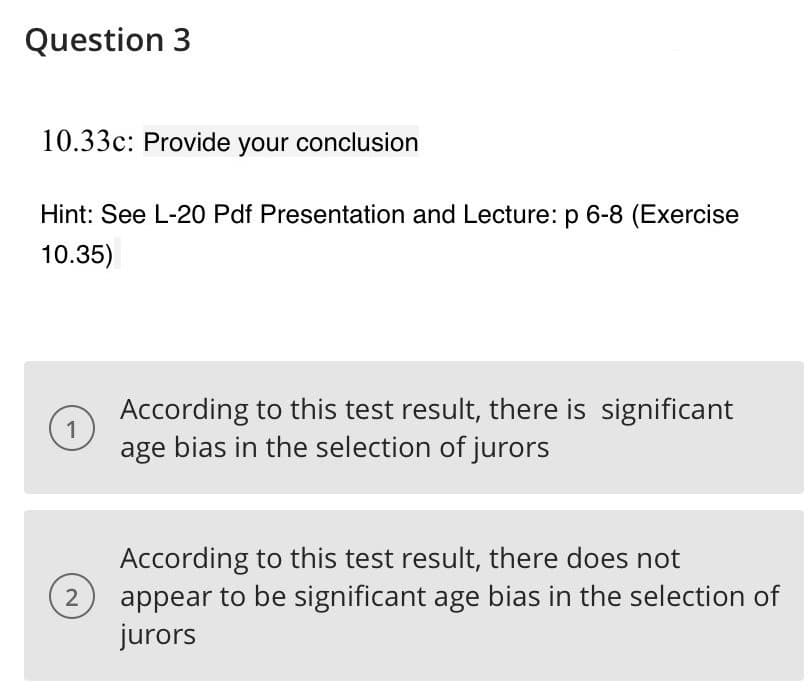
10.33c: Provide your conclusion
Hint: See L-20 Pdf Presentation and Lecture: p 6-8 (Exercise
10.35)
According to this test result, there is significant
1
age bias in the selection of jurors
According to this test result, there does not
appear to be significant age bias in the selection of
jurors
2
Expert Solution
This question has been solved!
Explore an expertly crafted, step-by-step solution for a thorough understanding of key concepts.

This is a popular solution!

Trending now
This is a popular solution!

Step by step
Solved in 4 steps with 2 images

Recommended textbooks for you
MATLAB: An Introduction with Applications
Statistics
ISBN:
9781119256830
Author:
Amos Gilat
Publisher:
John Wiley & Sons Inc

Probability and Statistics for Engineering and th…
Statistics
ISBN:
9781305251809
Author:
Jay L. Devore
Publisher:
Cengage Learning

Statistics for The Behavioral Sciences (MindTap C…
Statistics
ISBN:
9781305504912
Author:
Frederick J Gravetter, Larry B. Wallnau
Publisher:
Cengage Learning
MATLAB: An Introduction with Applications
Statistics
ISBN:
9781119256830
Author:
Amos Gilat
Publisher:
John Wiley & Sons Inc
Probability and Statistics for Engineering and th…
Statistics
ISBN:
9781305251809
Author:
Jay L. Devore
Publisher:
Cengage Learning
Statistics for The Behavioral Sciences (MindTap C…
Statistics
ISBN:
9781305504912
Author:
Frederick J Gravetter, Larry B. Wallnau
Publisher:
Cengage Learning

Elementary Statistics: Picturing the World (7th E…
Statistics
ISBN:
9780134683416
Author:
Ron Larson, Betsy Farber
Publisher:
PEARSON

The Basic Practice of Statistics
Statistics
ISBN:
9781319042578
Author:
David S. Moore, William I. Notz, Michael A. Fligner
Publisher:
W. H. Freeman

Introduction to the Practice of Statistics
Statistics
ISBN:
9781319013387
Author:
David S. Moore, George P. McCabe, Bruce A. Craig
Publisher:
W. H. Freeman