
MATLAB: An Introduction with Applications
6th Edition
ISBN: 9781119256830
Author: Amos Gilat
Publisher: John Wiley & Sons Inc
expand_more
expand_more
format_list_bulleted
Related questions
Question
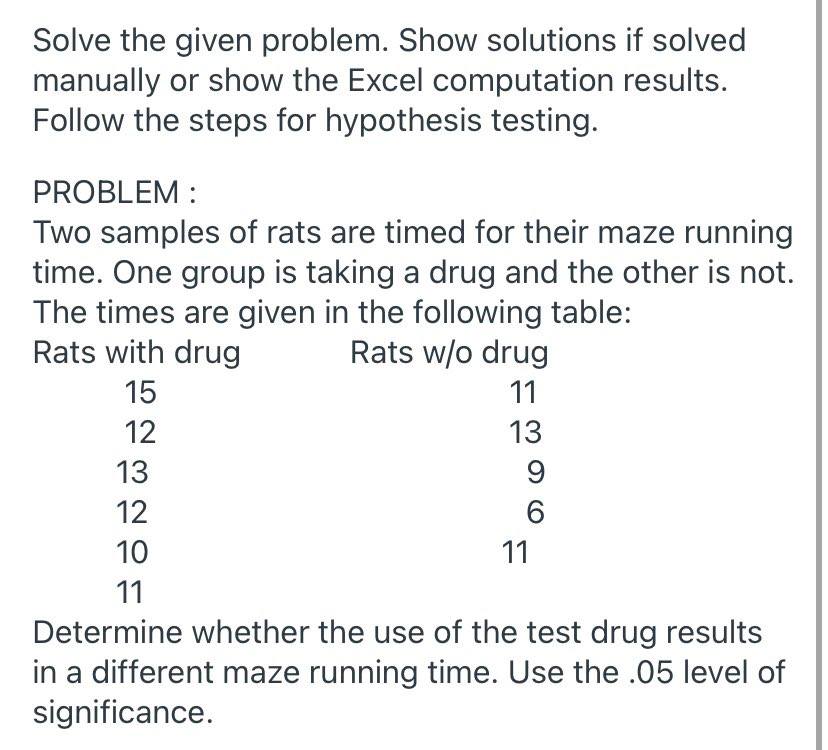

Transcribed Image Text:Solve the given problem. Show solutions if solved
manually or show the Excel computation results.
Follow the steps for hypothesis testing.
PROBLEM :
Two samples of rats are timed for their maze running
time. One group is taking a drug and the other is not.
The times are given in the following table:
Rats with drug
Rats w/o drug
15
11
12
13
13
12
10
11
11
Determine whether the use of the test drug results
in a different maze running time. Use the .05 level of
significance.
Expert Solution
This question has been solved!
Explore an expertly crafted, step-by-step solution for a thorough understanding of key concepts.

This is a popular solution

Trending nowThis is a popular solution!

Step by stepSolved in 2 steps with 2 images

Knowledge Booster

Similar questions
- how do i solve for parts b, d, and e?arrow_forwardrefer to image belowarrow_forwardBarry has several Christmas Cactus houseplants. He heard a rumor that they will bloom better if they are put in a dark room from October to November. What experiment could Barry design to test his hypothesis?arrow_forward
- Based from the photo, This is the step1, so step 2 and step 3 and Step 4 must be answered. (Step 2: Test Statistic -Pearson's r correlation coefficient AND Step 3: Critical Values, and Step 4: Solve For the test stat) so based it from the photo. The table shows the number of hours spend by 30 students in studing and their test scores. Solve for the Pearson’s r and interpret the results. Use 5% significance level. Step 1: Null and Alternative Hypothesis Ho: r = 0; There is no significant relationship between the number of hours spent studying and the students test scores. Ha: r ≠ 0; There is a significant relationship between the number of hours spent studying and the students test scores. Step 2: Test Statistic -Pearson's r correlation coefficient Step 3: Critical Values, Step 4: Solve For the test stat PLEASE SHOW ME COMPLETE SOLUTIONS AND CORRECT ANSWERS THANK YOU!! It was a pleasure to me. HIGHLIGHT STEP 4: (step 4 is must)!!arrow_forwardMolly works for a meat producer, and she needs to determine whether containers of ground beef have the correct fat content. She obtains a random sample of 120 containers of ground beef and finds that 84 percent have the correct fat content. Molly then conducts a hypothesis test of H0:p=0.80H0:p=0.80 versus Ha:p≠0.80Ha:p≠0.80 and calculates a test statistic of 1.10 with a pp-value of 0.273. Which of the following best represents the meaning of the pp-value? If the population proportion is 0.84, the probability of observing a sample proportion of 0.80 is 0.273. A If the population proportion is 0.84, the probability of observing a sample proportion of at least 0.04 less than 0.84 is 0.273. B If the population proportion is 0.80, the probability of observing a sample proportion within 0.04 of 0.80 is 0.273. C If the population proportion is 0.80, the probability of observing a sample proportion at least 0.04 greater than 0.80 is 0.273. D If the…arrow_forwardPlease solve for G, H, and I.arrow_forward
- You are interested in investigating the efficacy of a new pain medication and design an experiment measuring pain levels before and after the administration of a new medication. You recruit 9 people to participate in your study and bring the same 9 participants in for two separate sessions. Here is the raw data: Pair Number Placebo Pain Score Pain Medication Pain Score 1 2 4 5 6 7 8 9 5 7 10 5 8 7 8 6 8 QUESTION 20 5 5 8 4 4 3 5 3 2 Use the t-test handout printout provided to calculate the t- statistic. What is the t-test statistic value? Round to the nearest tenth. What conclusion would you make on the above data, based on the t-value you calculated and the critical value of t? O You accept the null hypothesis because the t-value you calculated is inside the bounds of the critical t-value O You reject the null hypothesis because the t-value you calculated is inside the bounds of the critical t-value O You reject the null hypothesis because the t-value you calculated is outside the…arrow_forwardA. Find the first quartile B. Find the 2nd quartile C. Find the 3rd quartilearrow_forwardNeed help with #19arrow_forward
- 1.) Write your solution A. Determine the 1" quartile, 2 quartile, 3rd quartile and interquartile range (IQR), given the scores of; 11, 24, 23, 11, 13, 17, 15, 19, 21, then interpret each of your answer. B. Solve for the Percentile Rank of 17.arrow_forwardThis is the step1, so step 2 and step 3 must be answered. (Step 2: Test Statistic -Pearson's r correlation coefficient AND Step 3: Critical Values ) so based it from the photo. Show COMPLETE SOLUTIONS. The table shows the number of hours spend by 30 students in studing and their test scores. Solve for the Pearson’s r and interpret the results. Use 5% significance level. Step 1: Null and Alternative Hypothesis Ho: r = 0; There is no significant relationship between the number of hours spent studying and the students test scores. Ha: r ≠ 0; There is a significant relationship between the number of hours spent studying and the students test scores.arrow_forward
arrow_back_ios
arrow_forward_ios
Recommended textbooks for you
- MATLAB: An Introduction with ApplicationsStatisticsISBN:9781119256830Author:Amos GilatPublisher:John Wiley & Sons Inc
 Probability and Statistics for Engineering and th...StatisticsISBN:9781305251809Author:Jay L. DevorePublisher:Cengage Learning
 Statistics for The Behavioral Sciences (MindTap C...StatisticsISBN:9781305504912Author:Frederick J Gravetter, Larry B. WallnauPublisher:Cengage Learning
  Elementary Statistics: Picturing the World (7th E...StatisticsISBN:9780134683416Author:Ron Larson, Betsy FarberPublisher:PEARSON
 The Basic Practice of StatisticsStatisticsISBN:9781319042578Author:David S. Moore, William I. Notz, Michael A. FlignerPublisher:W. H. Freeman
 Introduction to the Practice of StatisticsStatisticsISBN:9781319013387Author:David S. Moore, George P. McCabe, Bruce A. CraigPublisher:W. H. Freeman
MATLAB: An Introduction with Applications
Statistics
ISBN:9781119256830
Author:Amos Gilat
Publisher:John Wiley & Sons Inc
Probability and Statistics for Engineering and th...
Statistics
ISBN:9781305251809
Author:Jay L. Devore
Publisher:Cengage Learning
Statistics for The Behavioral Sciences (MindTap C...
Statistics
ISBN:9781305504912
Author:Frederick J Gravetter, Larry B. Wallnau
Publisher:Cengage Learning
Elementary Statistics: Picturing the World (7th E...
Statistics
ISBN:9780134683416
Author:Ron Larson, Betsy Farber
Publisher:PEARSON
The Basic Practice of Statistics
Statistics
ISBN:9781319042578
Author:David S. Moore, William I. Notz, Michael A. Fligner
Publisher:W. H. Freeman
Introduction to the Practice of Statistics
Statistics
ISBN:9781319013387
Author:David S. Moore, George P. McCabe, Bruce A. Craig
Publisher:W. H. Freeman