Statement of Financial Position As at December 31, 2013 (in S) Equity Non-current assets Property, plant, and equipment Preferred shares 2,600,000 100,000 (700,000) Common shares 1,900,000 Retained earnings Accumulated depreciation 500,000 Total non-current assets 560,000 Total equity 1,160,000 Long-term borrowings 1,640,000 Current assets Current liabilities Trade and other payables Notes payable Inventories 1,100,000 710,000 Trade receivables 900,000 250,000 Term deposits 120,000 260,000 Accruals Cash Current income taxes payable 90,000 2,210,000 4,110,000 90,000 Total current assets Total current liabilities 1,310,000 Total assets Total equity and liabilities 4,110,000 Statement of Income For the year ended December 31, 2013 (in S) Revenue 4,500,000 Cost of sales Gross profit (3,300,000) 1,200,000 Other income 20,000 Expenses Distribution costs (350,000) (100,000) Rent Administrative expenses (345,000) (795,000) Finance costs (120,000) (50,000) (945,000) Depreciation Total other income/costs Profit before taxes 255,000 Income tax expense (127,500) 1 27,500 Profit for the year
Statement of Financial Position As at December 31, 2013 (in S) Equity Non-current assets Property, plant, and equipment Preferred shares 2,600,000 100,000 (700,000) Common shares 1,900,000 Retained earnings Accumulated depreciation 500,000 Total non-current assets 560,000 Total equity 1,160,000 Long-term borrowings 1,640,000 Current assets Current liabilities Trade and other payables Notes payable Inventories 1,100,000 710,000 Trade receivables 900,000 250,000 Term deposits 120,000 260,000 Accruals Cash Current income taxes payable 90,000 2,210,000 4,110,000 90,000 Total current assets Total current liabilities 1,310,000 Total assets Total equity and liabilities 4,110,000 Statement of Income For the year ended December 31, 2013 (in S) Revenue 4,500,000 Cost of sales Gross profit (3,300,000) 1,200,000 Other income 20,000 Expenses Distribution costs (350,000) (100,000) Rent Administrative expenses (345,000) (795,000) Finance costs (120,000) (50,000) (945,000) Depreciation Total other income/costs Profit before taxes 255,000 Income tax expense (127,500) 1 27,500 Profit for the year

Intermediate Accounting: Reporting And Analysis
3rd Edition
ISBN:9781337788281
Author:James M. Wahlen, Jefferson P. Jones, Donald Pagach
Publisher:James M. Wahlen, Jefferson P. Jones, Donald Pagach
Chapter13: Investments And Long-term Receivables
Section: Chapter Questions
Problem 2MC: During 2021, Anthony Company purchased debt securities as a long-term investment and classified them...

Related questions
Question
Instructions for Case 1 - Pickwick Restaurants:
Calculate each ratio listed above and provide a one-word comment on whether the ratio measure is better, worse or the same as last year.
Last year's numbers are provided below.
Organize the ratios into four broad categories and then briefly comment (140 characters per category) on your analysis of Pickwick Restaurants' 2013 Financial Statements. For example, where is the business performance trending favorably and where might Jaclyn need to devote some attention?
You do not need to answer the "explain the meaning and significance of each ratio" part of the question.
Last year:
- Current 1.25 times
- Quick 0.8 times
- Debt to total assets 65.8%
- Debt to equity 1.92 times
- Times interest earned 3.2 times
- Fixed charges coverage 2.0 times
- Average collection period 76 days
- Inventory turnover 2.5 times
- Capital assets turnover 2.36 times
- Total assets turnover 1.15 times
- Profit margin 8.0%
- Return on revenue 4.0%
- Return on total assets 5.5%
- Return on equity 13.0%
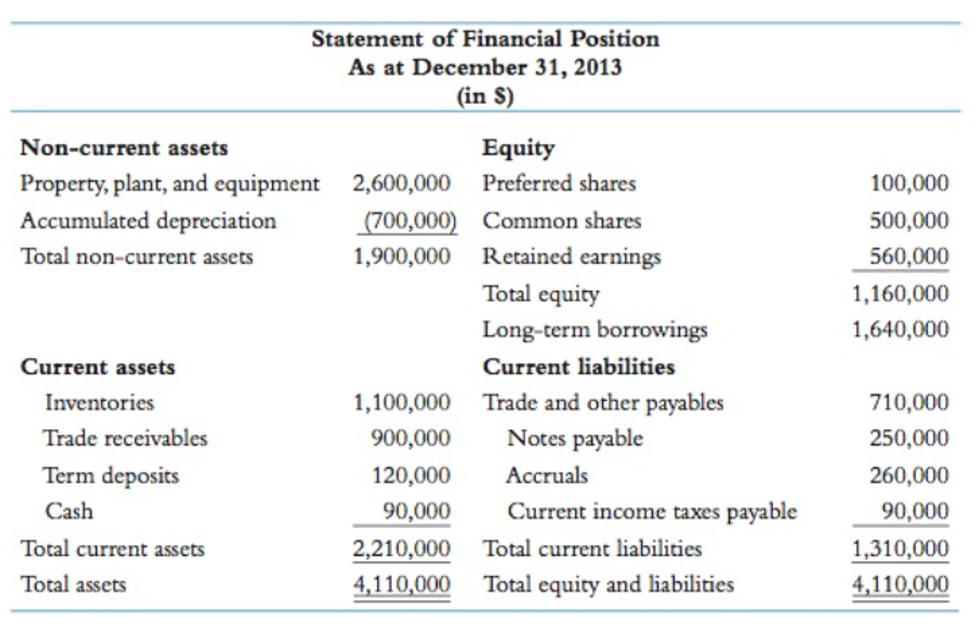
Transcribed Image Text:Statement of Financial Position
As at December 31, 2013
(in S)
Equity
Non-current assets
Property, plant, and equipment
Preferred shares
2,600,000
100,000
(700,000) Common shares
1,900,000 Retained earnings
Accumulated depreciation
500,000
Total non-current assets
560,000
Total equity
1,160,000
Long-term borrowings
1,640,000
Current assets
Current liabilities
Trade and other payables
Notes payable
Inventories
1,100,000
710,000
Trade receivables
900,000
250,000
Term deposits
120,000
260,000
Accruals
Cash
Current income taxes payable
90,000
2,210,000
4,110,000
90,000
Total current assets
Total current liabilities
1,310,000
Total assets
Total equity and liabilities
4,110,000
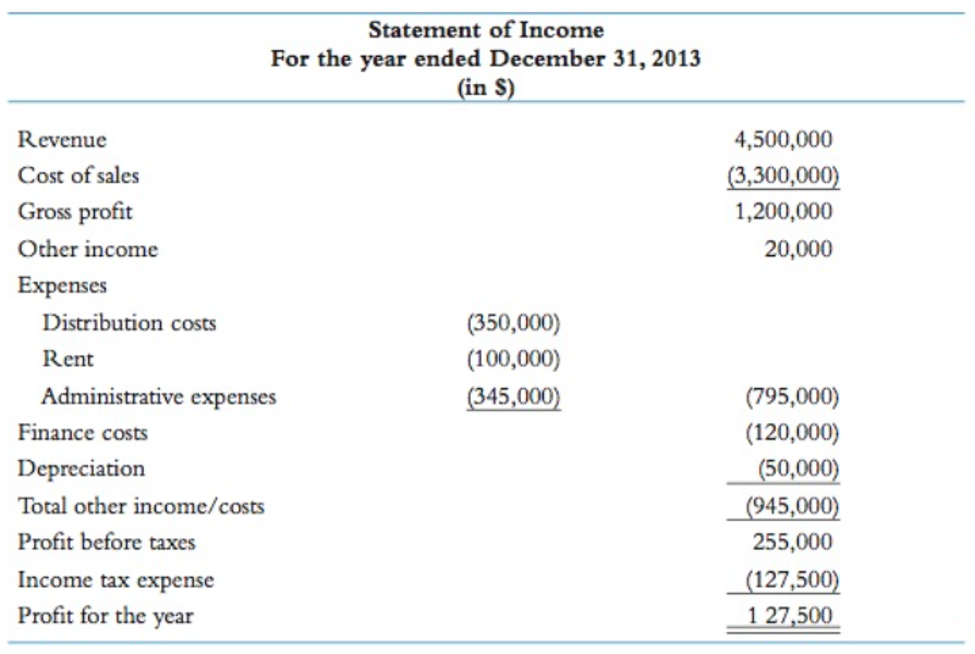
Transcribed Image Text:Statement of Income
For the year ended December 31, 2013
(in S)
Revenue
4,500,000
Cost of sales
Gross profit
(3,300,000)
1,200,000
Other income
20,000
Expenses
Distribution costs
(350,000)
(100,000)
Rent
Administrative expenses
(345,000)
(795,000)
Finance costs
(120,000)
(50,000)
(945,000)
Depreciation
Total other income/costs
Profit before taxes
255,000
Income tax expense
(127,500)
1 27,500
Profit for the year
Expert Solution
This question has been solved!
Explore an expertly crafted, step-by-step solution for a thorough understanding of key concepts.

This is a popular solution!

Trending now
This is a popular solution!

Step by step
Solved in 3 steps with 3 images

Knowledge Booster


Learn more about
Need a deep-dive on the concept behind this application? Look no further. Learn more about this topic, accounting and related others by exploring similar questions and additional content below.Recommended textbooks for you
Intermediate Accounting: Reporting And Analysis
Accounting
ISBN:
9781337788281
Author:
James M. Wahlen, Jefferson P. Jones, Donald Pagach
Publisher:
Cengage Learning
Intermediate Accounting: Reporting And Analysis
Accounting
ISBN:
9781337788281
Author:
James M. Wahlen, Jefferson P. Jones, Donald Pagach
Publisher:
Cengage Learning