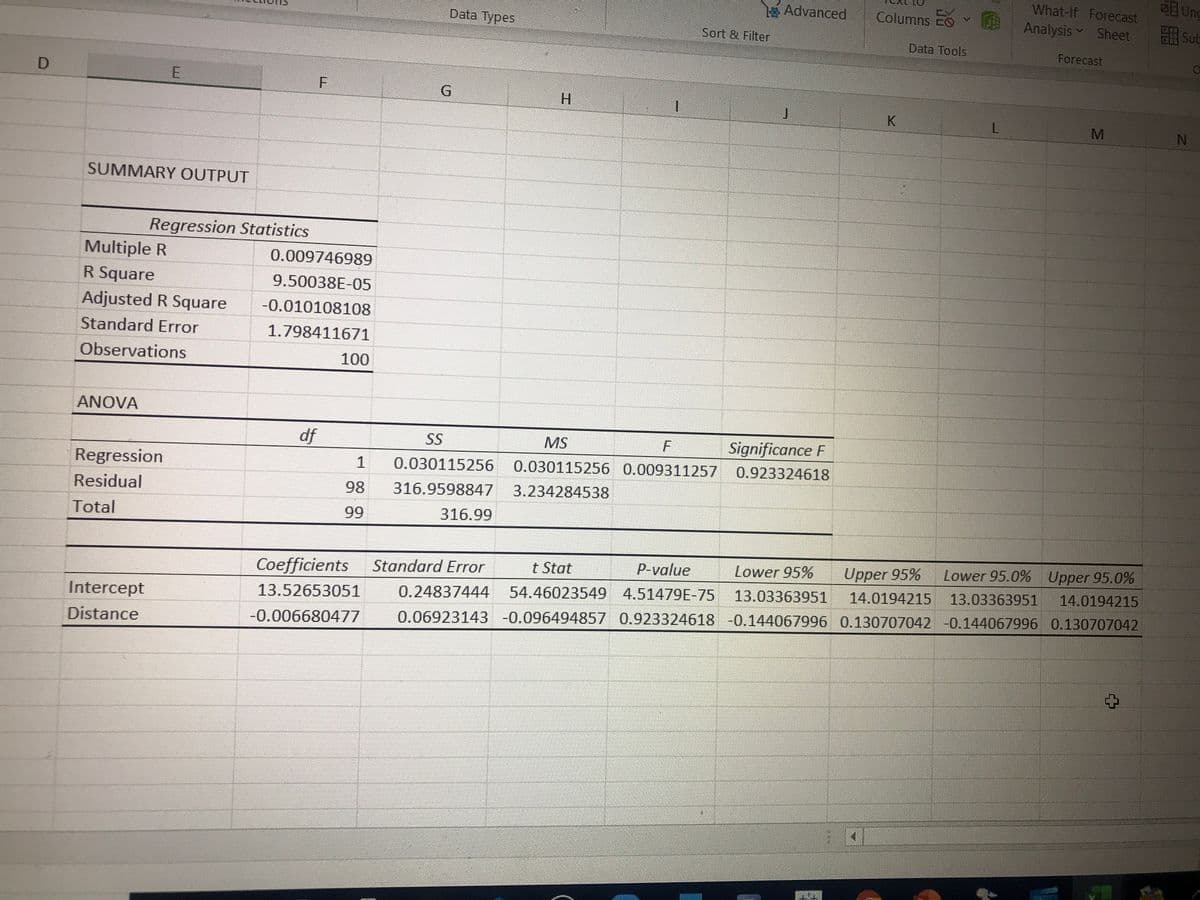
SUMMARY OUTPUT Regression Statistics Multiple R 0.009746989 R Square 9.50038E-05 Adjusted R Square -0.010108108 Standard Error 1.798411671 Observations 100 ANOVA df SS MS Significance F Regression 0.030115256 0.030115256 0.009311257 0.923324618 Residual 98 316.9598847 3.234284538 Total 99 316.99 Lower 95.0% Upper 95.0% 14.0194215 Coefficients Standard Error t Stat P-value Lower 95% Upper 95% Intercept 13.52653051 0.24837444 54.46023549 4.51479E-75 13.03363951 14.0194215 13.03363951 -0.006680477 0.06923143 -0.096494857 0.923324618 -0.144067996 0.130707042 -0.144067996 0.130707042 Distance


Correlation
Correlation defines a relationship between two independent variables. It tells the degree to which variables move in relation to each other. When two sets of data are related to each other, there is a correlation between them.
Linear Correlation
A correlation is used to determine the relationships between numerical and categorical variables. In other words, it is an indicator of how things are connected to one another. The correlation analysis is the study of how variables are related.
Regression Analysis
Regression analysis is a statistical method in which it estimates the relationship between a dependent variable and one or more independent variable. In simple terms dependent variable is called as outcome variable and independent variable is called as predictors. Regression analysis is one of the methods to find the trends in data. The independent variable used in Regression analysis is named Predictor variable. It offers data of an associated dependent variable regarding a particular outcome.


Trending now
This is a popular solution!

Step by step
Solved in 3 steps


