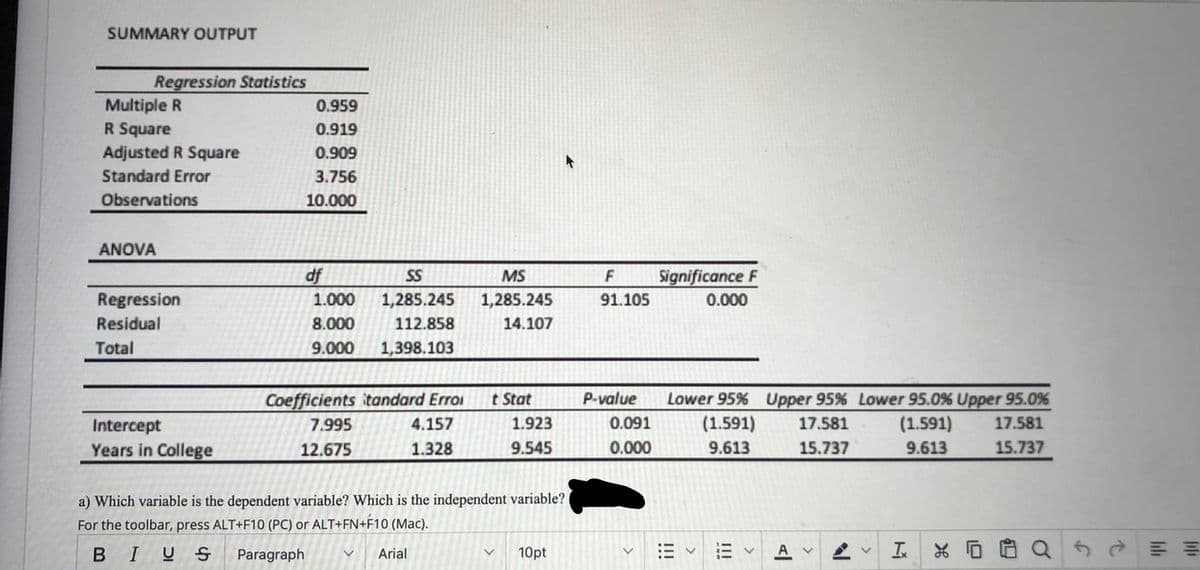
SUMMARY OUTPUT Regression Statistics Multiple R R Square Adjusted R Square 0.959 0.919 0.909 Standard Error 3.756 Observations 10.000 ANOVA Significance F df 1.000 SS MS Regression 1,285.245 1,285.245 91.105 0.000 Residual 8.000 112.858 14.107 Total 9.000 1,398.103 t Stat Lower 95% Upper 95% Lower 95.0% Upper 95.0% (1.591) 9.613 Coefficients itandard Erroi P-value Intercept 7.995 4.157 1.923 0.091 17.581 (1.591) 17.581 Years in College 12.675 1.328 9.545 0.000 15.737 9.613 15.737 a) Which variable is the dependent variable? Which is the independent variable? (
SUMMARY OUTPUT Regression Statistics Multiple R R Square Adjusted R Square 0.959 0.919 0.909 Standard Error 3.756 Observations 10.000 ANOVA Significance F df 1.000 SS MS Regression 1,285.245 1,285.245 91.105 0.000 Residual 8.000 112.858 14.107 Total 9.000 1,398.103 t Stat Lower 95% Upper 95% Lower 95.0% Upper 95.0% (1.591) 9.613 Coefficients itandard Erroi P-value Intercept 7.995 4.157 1.923 0.091 17.581 (1.591) 17.581 Years in College 12.675 1.328 9.545 0.000 15.737 9.613 15.737 a) Which variable is the dependent variable? Which is the independent variable? (

Glencoe Algebra 1, Student Edition, 9780079039897, 0079039898, 2018
18th Edition
ISBN:9780079039897
Author:Carter
Publisher:Carter
Chapter10: Statistics
Section10.4: Distributions Of Data
Problem 19PFA

Related questions
Question
Transcribed Image Text:SUMMARY OUTPUT
Regression Statistics
Multiple R
R Square
Adjusted R Square
0.959
0.919
0.909
Standard Error
3.756
Observations
10.000
ANOVA
df
SS
MS
Significance F
1.000
1,285.245
Regression
Residual
1,285.245
91.105
0.000
8.000
112.858
14.107
Total
9.000
1,398.103
t Stat
P-value
Lower 95% Upper 95% Lower 95.0% Upper 95.0%
(1.591)
Coefficients itandard Erroi
Intercept
7.995
4.157
1.923
0.091
17.581
(1.591)
17.581
Years in College
12.675
1.328
9.545
0.000
9.613
15.737
9.613
15.737
a) Which variable is the dependent variable? Which is the independent variable?
For the toolbar, press ALT+F10 (PC) or ALT+FN+F10 (Mac).
BIUS
Paragraph
Arial
10pt
I
!!!
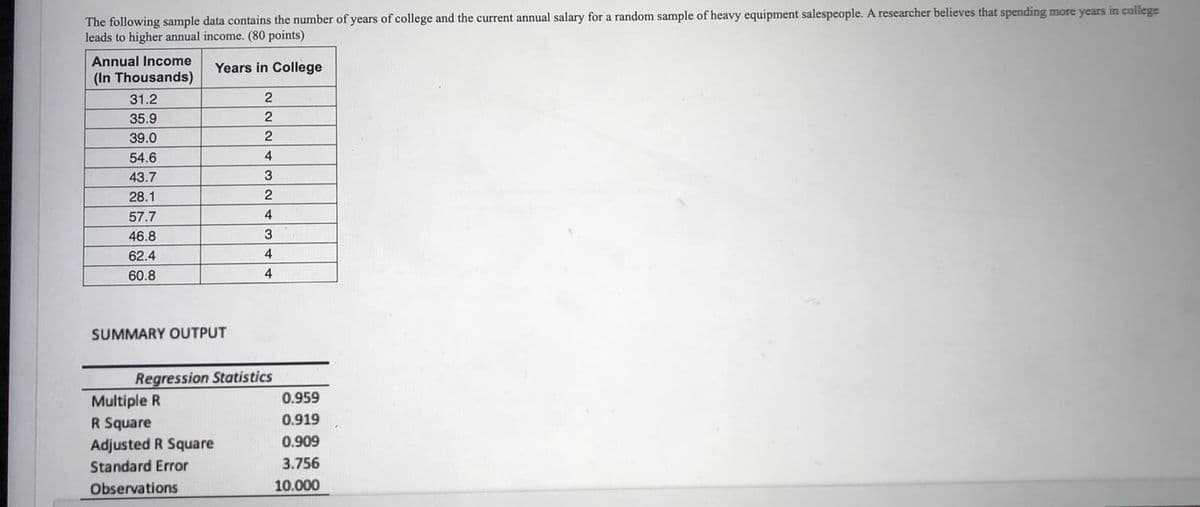
Transcribed Image Text:The following sample data contains the number of years of college and the current annual salary for a random sample of heavy equipment salespeople. A researcher believes that spending more years in college
leads to higher annual income. (80 points)
Annual Income
Years in College
(In Thousands)
31.2
2
35.9
2
39.0
54.6
4
43.7
3
28.1
57.7
4
46.8
62.4
4.
60.8
4
SUMMARY OUTPUT
Regression Statistics
Multiple R
R Square
Adjusted R Square
0.959
0.919
0.909
Standard Error
3.756
Observations
10.000
Expert Solution
This question has been solved!
Explore an expertly crafted, step-by-step solution for a thorough understanding of key concepts.

This is a popular solution!

Trending now
This is a popular solution!

Step by step
Solved in 2 steps with 1 images

Recommended textbooks for you
Glencoe Algebra 1, Student Edition, 9780079039897…
Algebra
ISBN:
9780079039897
Author:
Carter
Publisher:
McGraw Hill
Glencoe Algebra 1, Student Edition, 9780079039897…
Algebra
ISBN:
9780079039897
Author:
Carter
Publisher:
McGraw Hill