
MATLAB: An Introduction with Applications
6th Edition
ISBN: 9781119256830
Author: Amos Gilat
Publisher: John Wiley & Sons Inc
expand_more
expand_more
format_list_bulleted
Related questions
Concept explainers
Question
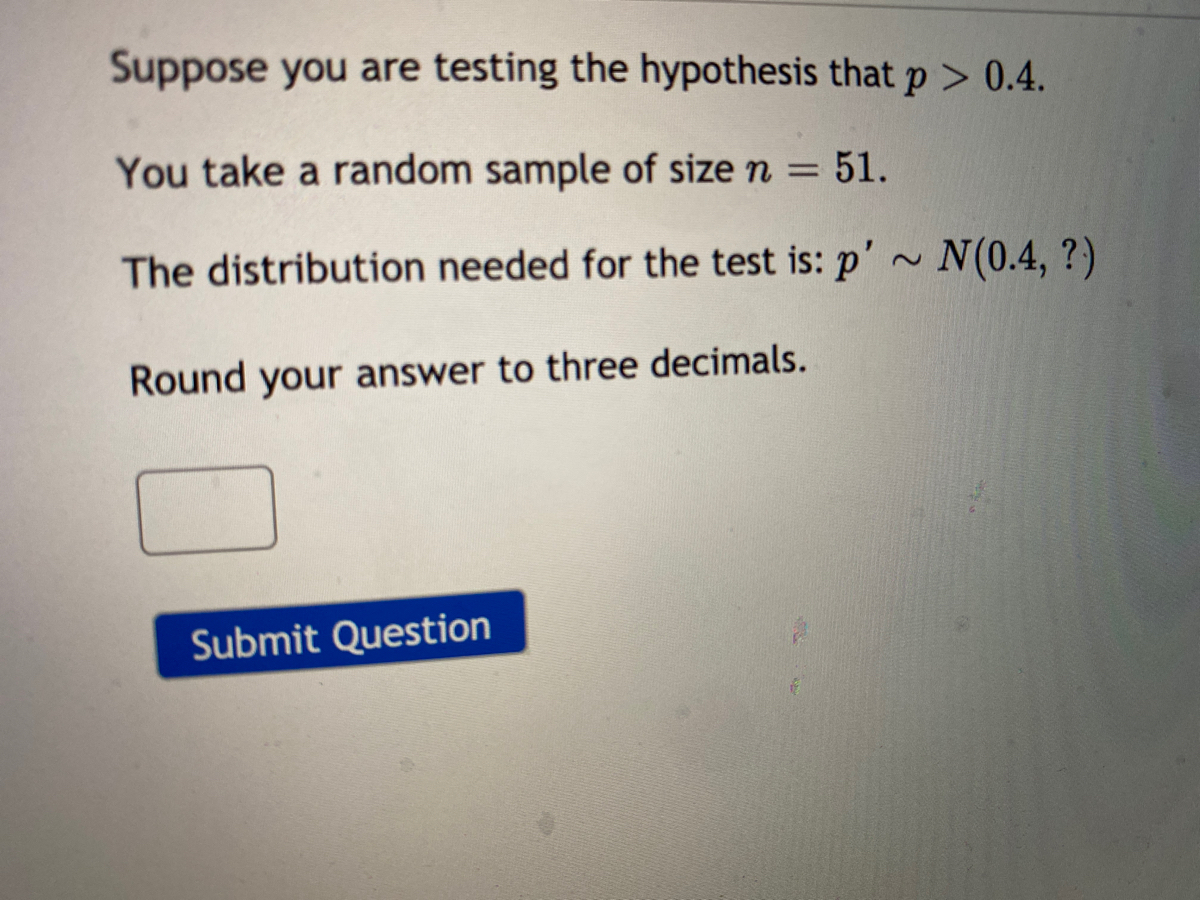

Transcribed Image Text:Suppose you are testing the hypothesis that p > 0.4.
You take a random sample of size n = 51.
%3D
The distribution needed for the test is: p'~ N(0.4, ?)
Round your answer to three decimals.
Submit Question
Expert Solution
This question has been solved!
Explore an expertly crafted, step-by-step solution for a thorough understanding of key concepts.

This is a popular solution

Trending nowThis is a popular solution!

Step by stepSolved in 2 steps with 1 images

Knowledge Booster


Learn more about
Need a deep-dive on the concept behind this application? Look no further. Learn more about this topic, statistics and related others by exploring similar questions and additional content below.Similar questions
- A baseball team claims that the mean length of its games is 2.4 hours. State H0 and Ha in words and in symbols. Then determine whether the hypothesis test for this claim is left-tailed, right-tailed, or two-tailed. Explain your reasoning. State the null hypothesis in words and in symbols. Choose the correct answer below. A. The null hypothesis expressed in words is, "the mean length of a baseball team's games is at most 2.4 hours." The null hypothesis is expressed symbolically as, "H0: μ≤2.4." B. The null hypothesis expressed in words is, "the mean length of a baseball team's games is more than 2.4 hours." The null hypothesis is expressed symbolically as, "H0: μ≠2.4." C. The null hypothesis expressed in words is, "the mean length of a baseball team's games is at least 2.4 hours." The null hypothesis is expressed symbolically as, "H0: μ≥2.4." D. The null hypothesis expressed in words is, "the mean length of a baseball…arrow_forwardIn the country of United States of Heightlandia, the height measurements of ten-year-old children are approximately normally distributed with a mean of 53.3 inches, and standard deviation of 2.2 inches.What is the probability that the height of a randomly chosen child is between 51.3 and 57.1 inches? Do not round until you get your your final answer, and then round to 3 decimal places.Answer=___________ (Round your answer to 3 decimal places.)arrow_forward↓ ve this Q In a random sample of males, it was found that 22 write with their left hands and 220 do not. In a random sample of females, it was found that 70 write with their left hands and 452 do not. Use a 0.01 significance level to test the claim that the rate of left-handedness among males is less than that among females. Complete parts (a) through (c) below. A N Z= -1.71 (Round to two decimal places as needed.) Identify the P-value. View an example 2 P-value=0.044 (Round to three decimal places as needed.) What is the conclusion based on the hypothesis test? The P-value is greater than the significance level of α = 0.01, so fail to reject the null hypothesis. There is not sufficient evidence to support the claim that the rate of left-handedness among males is less than that among females. b. Test the claim by constructing an appropriate confidence interval. The 98% confidence interval is < (P-P₂)< (Round to three decimal places as needed.) 34,339 W S F2 X H command #3 Get more…arrow_forward
- 7tharrow_forwardQuiz: Final Exam Spring 2021 Elementary-Statistics-2017.pdf Answered: Test the claim that the X + https://hartnell.instructure.com/courses/19398/quizzes/95019/take Consider the data below. Three random samples in different cities were selected. Water use per household per day were measured. City 1 City 2 City 3 60 56 66 60 64 66 55 45 54 60 41 61 65 58 65 45 44 64 45 46 Test the claim that the samples come from populations with the same mean. Assume all requirements have been met. Use a 5% level of significance. 1. Identify the tail of the test. [ Select ] 2. Find the P-value. [ Select] 3. Will the null hypothesis be rejected? [ Select ] 4. Do the populations appear to have the same mean? [Select ] 10:07 AM O Type here to search 5/21/2021 16 (8)arrow_forwardAnswerarrow_forward
- #5 It must be in the format of the second picture.arrow_forward#5 Find the 18th percentilearrow_forwardConstructed Response Question 2 A teacher claims that their students are missing more than 10% of the assignments for the third quarter. We take a random sample of 25 students and see that 12% of their assignments are missing. Using a = 0.05, can we support the teacher's claim? Perform a normal distribution rejection region hypothesis test for proportions. Show all seven steps.arrow_forward
arrow_back_ios
arrow_forward_ios
Recommended textbooks for you
- MATLAB: An Introduction with ApplicationsStatisticsISBN:9781119256830Author:Amos GilatPublisher:John Wiley & Sons Inc
 Probability and Statistics for Engineering and th...StatisticsISBN:9781305251809Author:Jay L. DevorePublisher:Cengage Learning
 Statistics for The Behavioral Sciences (MindTap C...StatisticsISBN:9781305504912Author:Frederick J Gravetter, Larry B. WallnauPublisher:Cengage Learning
  Elementary Statistics: Picturing the World (7th E...StatisticsISBN:9780134683416Author:Ron Larson, Betsy FarberPublisher:PEARSON
 The Basic Practice of StatisticsStatisticsISBN:9781319042578Author:David S. Moore, William I. Notz, Michael A. FlignerPublisher:W. H. Freeman
 Introduction to the Practice of StatisticsStatisticsISBN:9781319013387Author:David S. Moore, George P. McCabe, Bruce A. CraigPublisher:W. H. Freeman
MATLAB: An Introduction with Applications
Statistics
ISBN:9781119256830
Author:Amos Gilat
Publisher:John Wiley & Sons Inc
Probability and Statistics for Engineering and th...
Statistics
ISBN:9781305251809
Author:Jay L. Devore
Publisher:Cengage Learning
Statistics for The Behavioral Sciences (MindTap C...
Statistics
ISBN:9781305504912
Author:Frederick J Gravetter, Larry B. Wallnau
Publisher:Cengage Learning
Elementary Statistics: Picturing the World (7th E...
Statistics
ISBN:9780134683416
Author:Ron Larson, Betsy Farber
Publisher:PEARSON
The Basic Practice of Statistics
Statistics
ISBN:9781319042578
Author:David S. Moore, William I. Notz, Michael A. Fligner
Publisher:W. H. Freeman
Introduction to the Practice of Statistics
Statistics
ISBN:9781319013387
Author:David S. Moore, George P. McCabe, Bruce A. Craig
Publisher:W. H. Freeman