Table I: Sample of Result of student survey ID Gender Mathematics Exercise Games GPA Pulse 1 M Not too much 3-4 1 3.13 54 M Not too much More than 6 7 2.5 66 times 3 Really Don't Like 5 2.55 130 M it 1623 M L like it 1-2 8 3.3 77 1624 Not too much 1-2 2.8 60 1625 F Absolutely love it 3.7 94 1. Based on the case study, what is the: 1. sample: 2. secondary data 2. Identify the data type and its level of measurement for each data below: Data Data type Level of Measurement Gender Mathematics GPA 3. This year, Faculty A decided to add a second part of the survey. They were interested in the student's opinions on the new café in the faculty building. Identify if the possi answers are Qualitative or Quantitative Data: Questions Qualitative or Quantitative Data i How many times have you been to the new café? ii. What do you think about the food in new café?
Table I: Sample of Result of student survey ID Gender Mathematics Exercise Games GPA Pulse 1 M Not too much 3-4 1 3.13 54 M Not too much More than 6 7 2.5 66 times 3 Really Don't Like 5 2.55 130 M it 1623 M L like it 1-2 8 3.3 77 1624 Not too much 1-2 2.8 60 1625 F Absolutely love it 3.7 94 1. Based on the case study, what is the: 1. sample: 2. secondary data 2. Identify the data type and its level of measurement for each data below: Data Data type Level of Measurement Gender Mathematics GPA 3. This year, Faculty A decided to add a second part of the survey. They were interested in the student's opinions on the new café in the faculty building. Identify if the possi answers are Qualitative or Quantitative Data: Questions Qualitative or Quantitative Data i How many times have you been to the new café? ii. What do you think about the food in new café?

Glencoe Algebra 1, Student Edition, 9780079039897, 0079039898, 2018
18th Edition
ISBN:9780079039897
Author:Carter
Publisher:Carter
Chapter10: Statistics
Section: Chapter Questions
Problem 13PT

Related questions
Topic Video
Question
Please answer
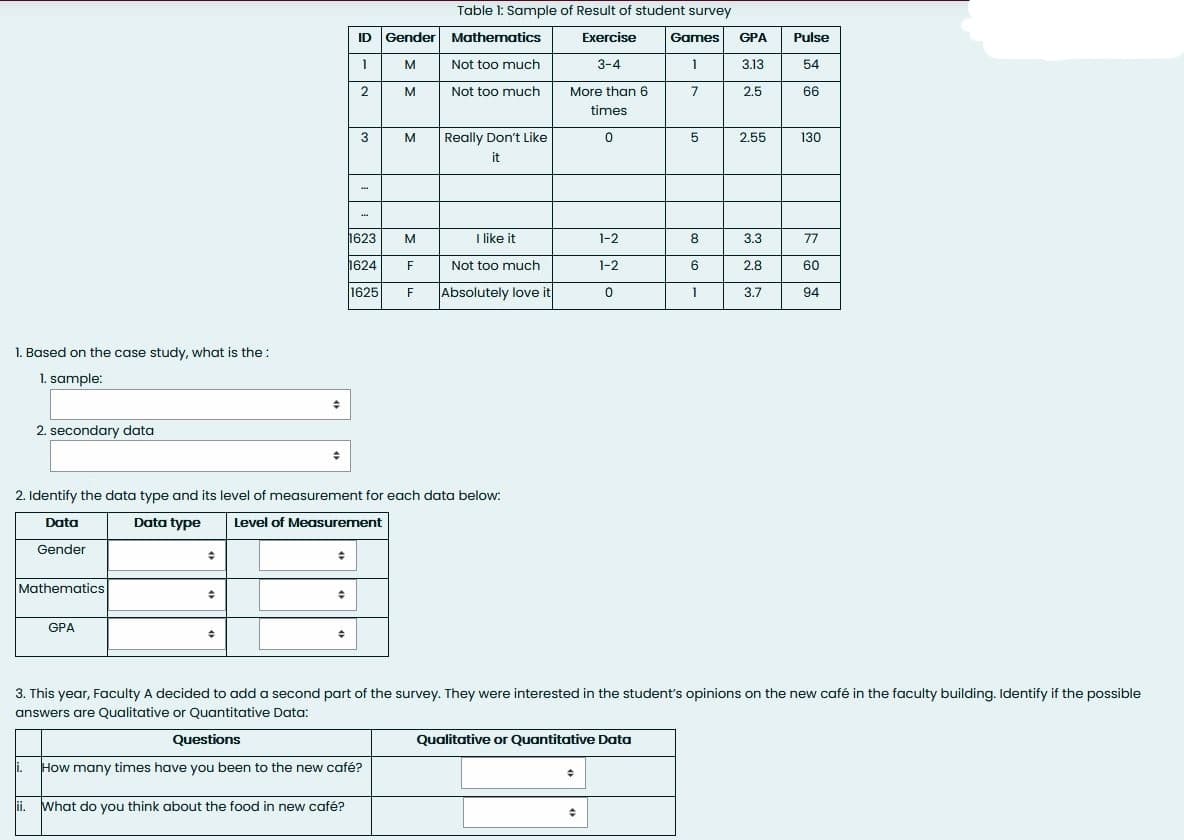
Transcribed Image Text:Table 1: Sample of Result of student survey
ID Gender Mathematics
Exercise
Pulse
Games
GPA
M
Not too much
3-4
3.13
54
M
Not too much
More than 6
7
2.5
66
times
M
Really Don't Like
2.55
130
it
1623
I like it
1-2
8
3.3
77
1624
F
Not too much
1-2
6
2.8
60
1625
F
Absolutely love it
1
3.7
94
1. Based on the case study, what is the :
1. sample:
2. secondary data
2. Identify the data type and its level of measurement for each data below:
Data
Data type
Level of Measurement
Gender
Mathematics
GPA
3. This year, Faculty A decided to add a second part of the survey. They were interested in the student's opinions on the new café in the faculty building. Identify if the possible
answers are Qualitative or Quantitative Data:
Questions
Qualitative or Quantitative Data
i.
How many times have you been to the new café?
ii.
What do you think about the food in new café?
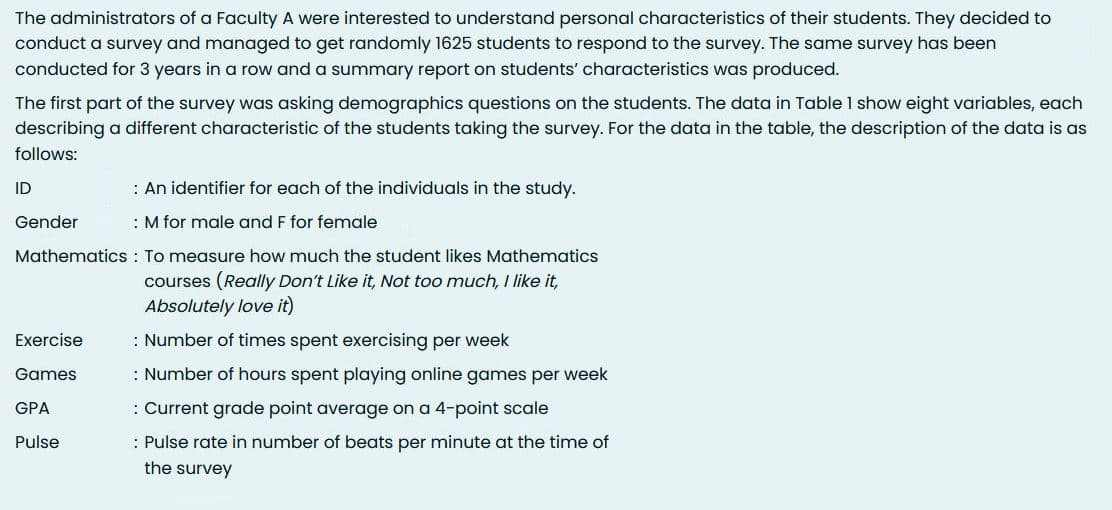
Transcribed Image Text:The administrators of a Faculty A were interested to understand personal characteristics of their students. They decided to
conduct a survey and managed to get randomly 1625 students to respond to the survey. The same survey has been
conducted for 3 years in a row and a summary report on students' characteristics was produced.
The first part of the survey was asking demographics questions on the students. The data in Table 1 show eight variables, each
describing a different characteristic of the students taking the survey. For the data in the table, the description of the data is as
follows:
ID
: An identifier for each of the individuals in the study.
Gender
: M for male and F for female
Mathematics : To measure how much the student likes Mathematics
courses (Really Don't Like it, Not too much, I like it,
Absolutely love it)
Exercise
: Number of times spent exercising per week
Games
: Number of hours spent playing online games per week
GPA
: Current grade point average on a 4-point scale
Pulse
: Pulse rate in number of beats per minute at the time of
the survey
Expert Solution
This question has been solved!
Explore an expertly crafted, step-by-step solution for a thorough understanding of key concepts.

Step by step
Solved in 4 steps

Knowledge Booster


Learn more about
Need a deep-dive on the concept behind this application? Look no further. Learn more about this topic, statistics and related others by exploring similar questions and additional content below.Recommended textbooks for you
Glencoe Algebra 1, Student Edition, 9780079039897…
Algebra
ISBN:
9780079039897
Author:
Carter
Publisher:
McGraw Hill

Holt Mcdougal Larson Pre-algebra: Student Edition…
Algebra
ISBN:
9780547587776
Author:
HOLT MCDOUGAL
Publisher:
HOLT MCDOUGAL

Big Ideas Math A Bridge To Success Algebra 1: Stu…
Algebra
ISBN:
9781680331141
Author:
HOUGHTON MIFFLIN HARCOURT
Publisher:
Houghton Mifflin Harcourt
Glencoe Algebra 1, Student Edition, 9780079039897…
Algebra
ISBN:
9780079039897
Author:
Carter
Publisher:
McGraw Hill
Holt Mcdougal Larson Pre-algebra: Student Edition…
Algebra
ISBN:
9780547587776
Author:
HOLT MCDOUGAL
Publisher:
HOLT MCDOUGAL
Big Ideas Math A Bridge To Success Algebra 1: Stu…
Algebra
ISBN:
9781680331141
Author:
HOUGHTON MIFFLIN HARCOURT
Publisher:
Houghton Mifflin Harcourt

College Algebra (MindTap Course List)
Algebra
ISBN:
9781305652231
Author:
R. David Gustafson, Jeff Hughes
Publisher:
Cengage Learning