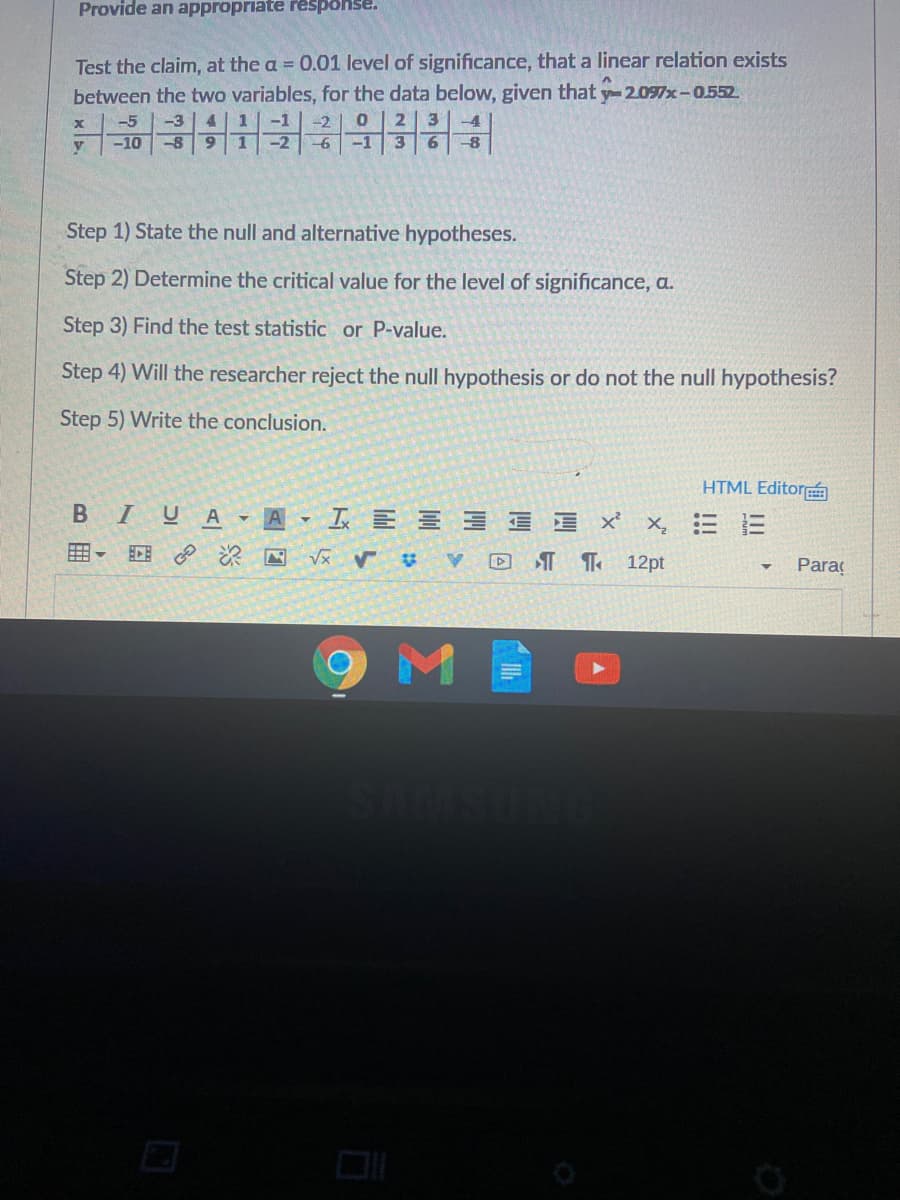
Test the claim, at the a = 0.01 level of significance, that a linear relation exists between the two variables, for the data below, given that y-2.097x-0.552 %3D -5 -3 4 1 -2 2 3 <-10 -8 91 -6 -1 6.


Correlation
Correlation defines a relationship between two independent variables. It tells the degree to which variables move in relation to each other. When two sets of data are related to each other, there is a correlation between them.
Linear Correlation
A correlation is used to determine the relationships between numerical and categorical variables. In other words, it is an indicator of how things are connected to one another. The correlation analysis is the study of how variables are related.
Regression Analysis
Regression analysis is a statistical method in which it estimates the relationship between a dependent variable and one or more independent variable. In simple terms dependent variable is called as outcome variable and independent variable is called as predictors. Regression analysis is one of the methods to find the trends in data. The independent variable used in Regression analysis is named Predictor variable. It offers data of an associated dependent variable regarding a particular outcome.
Hello! As you have posted more than 3 sub parts, we are answering the first 3 sub-parts. In case you require the unanswered parts also, kindly re-post that parts separately.
Step 1:
Null Hypothesis:
H0: There is no linear relationship between two variables.
Alternative Hypothesis:
H1: There is a linear relationship between two variables.
Step 2:
Given significance level=0.01
Sample size, n=10
df=n-2=10-2=8
t critical value= from the excel function, =T.INV.2T(0.01,8)

Step by step
Solved in 2 steps with 1 images


