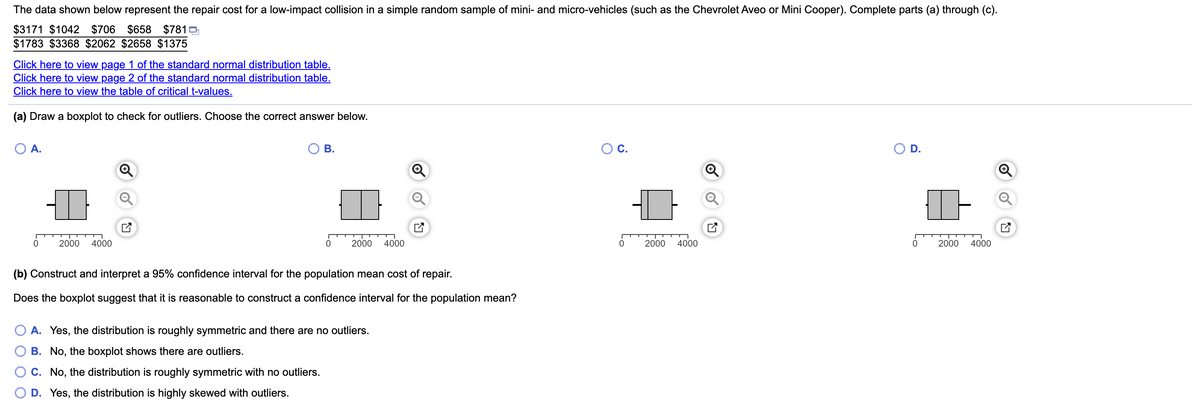
The data shown below represent the repair cost for a low-impact collision in a simple random sample of mini- and micro-vehicles (such as the Chevrolet Aveo or Mini Cooper). Complete parts (a) through (c). $3171 $1042 $706 $658 $7810 $1783 $3368 $2062 $2658 $1375 Click here to view page 1 of the standard normal distribution table. Click here to view page 2 of the standard normal distribution table, Click here to view the table of critical t-values. (a) Draw a boxplot to check for outliers. Choose the correct answer below. O A. OB. Oc. OD. o 2000 4000 4000 2000 4000 4000 2000 (b) Construct and interpret a 95% confidence interval for the population mean cost of repair. Does the boxplot suggest that it is reasonable to construct a confidence interval for the population mean? O A. Yes, the distribution is roughly symmetric and there are no outliers. O B. No, the boxplot shows there are outliers. OC. No, the distribution is roughly symmetric with no outliers. O D. Yes, the distribution is highly skewed with outliers.


Correlation
Correlation defines a relationship between two independent variables. It tells the degree to which variables move in relation to each other. When two sets of data are related to each other, there is a correlation between them.
Linear Correlation
A correlation is used to determine the relationships between numerical and categorical variables. In other words, it is an indicator of how things are connected to one another. The correlation analysis is the study of how variables are related.
Regression Analysis
Regression analysis is a statistical method in which it estimates the relationship between a dependent variable and one or more independent variable. In simple terms dependent variable is called as outcome variable and independent variable is called as predictors. Regression analysis is one of the methods to find the trends in data. The independent variable used in Regression analysis is named Predictor variable. It offers data of an associated dependent variable regarding a particular outcome.
|
|


Trending now
This is a popular solution!

Step by step
Solved in 3 steps with 7 images


