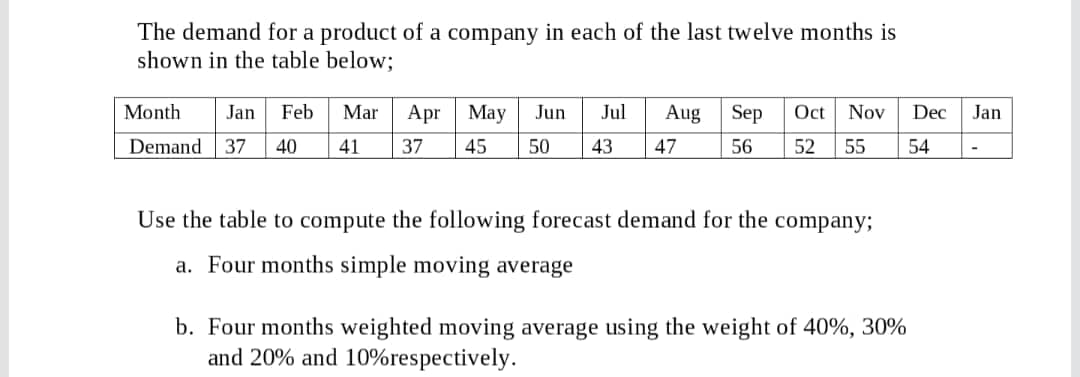
The demand for a product of a company in each of the last twelve months is shown in the table below; Month Jan Feb Mar Apr May Jun Jul Aug Sep Oct Nov Dec Jan Demand 37 40 41 37 45 50 43 47 56 52 55 54
Q: Bulan/Month Iualan/sales 1 785 2 600 578 4 590 5 770 805 7 710 8 900 Compute a 3-months moving…
A: Given Solution: A three month moving average is a forecasting method which identifying the average…
Q: b) The price and monthly quantities of five materials purchased by a manufacturer in the years 2020…
A: The price and monthly quantities of five materials purchased by a manufacturer is in the following…
Q: Suppose that the price p of a product and its demand x are related through the price-demand equation…
A: The price –demand equation is
Q: А в с D Сарacity F1 12 18 6 25 200 F2 8 7 7 10 18 500 F3 14 3 11 20 300 Demand 180 320 100 400
A:
Q: The table below gives the annual sales (in millions) of a product. year 1998 1999 2000 | 2001 2002…
A:
Q: The table below gives the annual sales (in millions) of a product. 1998 1999 2000 2001 2002 2003…
A:
Q: The table below gives the annual sales (in millions) of a product. 1998 1999 2000 2001 2002 2003…
A: Given query is to find the average rate of change for indicated years.
Q: The table shows earnings per share of a corporation over a period of 30 years. Year Earnings Year…
A: c. Null Hypothesis: H0: There is no autocorrelation among the error terms. Alternative Hypothesis:…
Q: Milka makes boxes of chocolates for which the demand is uncertain. " Quarterly demand (in boxes of…
A: Given information: Quarter Year 1 Year 2 Year 3 1 3000 3300 3502 2 1700 2100 2448 3 900…
Q: The graphs of the demand function and supply function for a certain product, are given below. Use…
A: So, when p=$100 the demand will be 600 units. So, when p=$100 the supply will be 300 units.
Q: The table below gives the annual sales (in millions) of a product. 1998 year sales 1999 2000 2001…
A:
Q: Data collected on the yearly demand for 50-pound bags of fertilizer at Wallace Garden Supply are…
A: In statistics, a moving average is a calculation used to analyze data points by creating a series of…
Q: Calculate Price Index using Fisher's Method and Bowley's formula: Current year Base year Quantity…
A:
Q: XYZ Company, Annual Data Actual Demand. Forecasted Demand 15 14 15…
A: The formula for mean absolute deviation is MAD = (Σ|At – Ft|)/n, where At is the actual value and Ft…
Q: The table below gives the annual sales (in millions) of a product. year 1998 1999 2000 2001 2002…
A: Here sales of different year are given in the data a)sales in year 2003 = 204 Sales in year 2002 =…
Q: 2)- Industrial engineers periodically conduct "work measurement' analysis to determine the time…
A: Answer for a) Mean= 117.82 Median = 117.5 Mode = 97,112,124,128, and 131
Q: This is the following demand data: Period Demand 1 40 2 55 60 4 35 30 6. 52
A: Given information: The data represents the values of demand for the time periods 1 through 8.
Q: (c) Table 1 shows the daily income of fruit sellers. 100 120 120 110 200 180 170 160 145 120 Table…
A: Given data, 100 120 120 110 200 180 170 160 145 120 Arrange the data in the ascending order 100 110…
Q: The following table shows the monthly sales of a product for a 2-year period. Year Jan | Feb. | Mar.…
A: a) Forecast sales for year 2 by using 3-month moving average: From the given information, Excel…
Q: The table below gives the annual sales (in millions) of a product. 2012 2013 2014 2015 2016 2017 249…
A: The table is given by To evaluate: (a) The average rate of change of the annual sales between 2015…
Q: The table below gives the annual sales (in millions) of a product. 1998 year sales 1999 2000 2001…
A:
Q: The table below gives the annual sales (in millions) of a product. year 1998 1999 2000 2001 2002…
A: Given, The table below gives the annual sales in millions of a product.
Q: The table below gives the annual sales (in millions) of a product. 1998 1999 2000 2001 2002 2003…
A: Use avg rate of change formula
Q: pllowing are the data on demand for white bread loave Day 2 3 4 5 6 7 8 9 10 11 12 Loaves 199 209…
A: day loaves 1 199 2 209 3 215 4 226 5 233 6 237 7 252 8 257 9 253 10 265 11…
Q: Total Cost and Variable Cost for Producing Quebces 300 250 200 150 100 50 - 5 10 15 20 25 30 35 40…
A: From these two curves, we have to form a function for the total cost.
Q: The table below gives the annual sales (in millions) of a product. A 1998 1999 2000 2001 2002 2003…
A:
Q: 2)- Industrial engineers periodically conduct "work measurement' analysis to determine the time…
A: Arrange the given data in ascending order: 88, 92, 95, 97, 97, 97, 98, 98, 100, 100, 103, 108, 109,…
Q: Two different forecasting techniques (F1 and F2) were used to forecast demand for cases of bottled…
A: we need to find MSE and MAPE MSE = Average(dev^2) = 253/8 = 31.62 MAPE = Average((abs…
Q: Monthly data for the demand of an item are shown in the table below. 1 2 3 45 6 Month Demand 93 99…
A: The given table is as follows:
Q: he average costs for college tuition and their quantities in 2010 and 2020 2010 Cost Quantity Cost…
A: The formula for computing Laspeyer's index is, Here po is the cost of base year and qo is quantity…
Q: 2)- Industrial engineers periodically conduct "work measurement' analysis to determine the time…
A:
Q: (c) Table 1 shows the daily income of fruit sellers. 100 120 120 110 200 180 170 160 145 120 Table 1…
A:
Q: The profits of a Company for the last 8 years are given below. Calculate the Range and its…
A:
Q: Bread Water Plows Metal Quantity Price Quantity Quantity $1 Price Quantity Price Price 2011 $2 100…
A: We need to calculate real value of water in each year to determine in which year it is most…
Q: Daily demand for marigold flowers at a large garden store is shown below. Compute:a. A three-period…
A: The Moving Average Forecasts so you can get a better understanding of the outcome that will be…
Q: Suppose we have the following data for two years-1998–99 and 1999–2000. Items 1998–99 (*000 Rs)…
A:
Q: The table below gives the annual sales (in millions) of a product. 1998 1999 227 2000 2001 2002 2003…
A: Given,
Q: 2)- Industrial engineers periodically conduct "work measurement' analysis to determine the time…
A: Solution : c) Given : n = 50 Let, Y : Number of total worker hours required per day to perform a…
Q: The table below gives the annual sales (in millions) of a product. 1998 1999 2000 2001 2002 year…
A:
Q: Given the following data, calculate the three-month moving average forecasts formonths 4, 5, 6, and…
A: Using the following data, we need to calculate the three-month moving average forecasts formonths 4,…
Q: Let the demand function for a product made in Cleveland is given by the function D(q
A:
Q: 3-Given the following demand. What is the forecast for period 6 and 18. Period demand base (a = .70…
A: The following information are given,
Q: Data collected on the yearly demand for 50-pound bags of are shown in the following table. Year…
A: Given the yearly demand for 50-pound bags data as Year Demand for fertilizer 1 4 2 6 3 4…
Q: Based on the information in the following table, use the Naïve Approach to forecast the demand for…
A: According to the Naive approach, the best forecast for a future period is given by the observed…
Q: 5. Estimate the production for the years 2008 and 2010 with the help d following table : Year…
A:
Q: 10. Compute by Fisher's formula the Quantity Index Number from the data given 2006 2004 Total Value…
A: Index Numbers: index numbers are numerical figures which indicate the relative position in respect…
Q: The table below gives the annual sales (in millions) of a product. 2013 2014 2015 2016 2017 2018…
A:
Q: Provide a bar chart (with data labels rounded to two decimal points) showing the average demand for…
A: Consider the following table:- Weekday Date Sum of Daily Demand Average Mon…
Q: Using exponential smoothing, calculate the forecasts for months 2, 3, 4, 5, and 6. Thesmoothing…
A: Solution: Given information: α=0.2 Smoothing constant The forecast for month one is 245
Percentage
A percentage is a number indicated as a fraction of 100. It is a dimensionless number often expressed using the symbol %.
Algebraic Expressions
In mathematics, an algebraic expression consists of constant(s), variable(s), and mathematical operators. It is made up of terms.
Numbers
Numbers are some measures used for counting. They can be compared one with another to know its position in the number line and determine which one is greater or lesser than the other.
Subtraction
Before we begin to understand the subtraction of algebraic expressions, we need to list out a few things that form the basis of algebra.
Addition
Before we begin to understand the addition of algebraic expressions, we need to list out a few things that form the basis of algebra.
solve without using excel and write down all calculations and formular used.
Step by step
Solved in 3 steps
- The following table gives the number of pints of type A blood used at Damascus Hospital in the past 6 weeks: Week Of Pints UsedAugust 31 360September 7 389September 14 410September 21 378September 28 368October 5 374 a) The forecasted demand for the week of October 12 using a 3-week moving average = 373.33 pints (round your response to two decimal places). b) Using a 3-week weighted moving average, with weights of 0.15, 0.25, and 0.60, using 0.60 for the most recent week, the forecasted demand for the week of October 12 = ? pints (round your response to two decimal places and remember to use the weights in appropriate order — the largest weight applies to most recent period and smallest weight applies to oldest period.)These data show the number of gallons of gasoline sold by a gasoline distributor in Bennington, Vermont, over the past 12 weeks. Week Sales (1,000sof gallons) 1 17 2 21 3 19 4 23 5 18 6 16 7 20 8 18 9 22 10 20 11 15 12 22 (a) Compute the MSE for the four-week moving average forecasts. (Round your answer to two decimal places.) Compute the MSE for the five-week moving average forecasts. (Round your answer to two decimal places.) (b) What appears to be the best number of weeks of past data (three, four, or five) to use in the moving average computation? MSE for the three-week moving average is 10.22. - Three weeks appears to be best, because the three-week moving average provides the smallest MSE. - Three weeks appears to be best, because the three-week moving average provides the largest MSE. - Four weeks appears to be best, because the four-week moving average provides the smallest MSE. - Five weeks appears to be best, because the five-week…The customer demand for a particular smart phone during Year 0 to Year 5 is given as 1,056,000, 1,032,000, 1,093,000, 1,024,000, 1,066,000, and 1,072,000. Using the Holt forecasting model with trend, what is the forecasted demand in year 10, where w = 0.4 and v = 0.5?a) 1,071,874b) 1,075,573c) 1,077,488d) 1,083,816
- Suppose these data show the number of gallons of gasoline sold by a gasoline distributor in Bennington, Vermont, over the past 12 weeks. Week Sales (1,000sof gallons) 1 18 2 21 3 20 4 24 5 19 6 16 7 20 8 18 9 22 10 21 11 15 12 23 (a) Compute four-week and five-week moving averages for the time series.4-week moving average forecast & 5 week moving average forecast (b) Compute the MSE for the four-week moving average forecasts. (Round your answer to two decimal places.) Compute the MSE for the five-week moving average forecasts. (Round your answer to two decimal places.) c) What appears to be the best number of weeks of past data (three, four, or five) to use in the moving average computation? MSE for the three-week moving average is 12.22. Three weeks appears to be best, because the three-week moving average provides the smallest MSE .Three weeks appears to be best, because the three-week moving average provides the largest MSE. Four weeks appears…Observations of the demand for a certain part stocked at a parts supply depot during the calendaryear 2013 were: Month Demand Month Demand Jan 89 july 223 Feb 57 august 286 mar 144 sept 212 april 221 oct 275 may 177 nov 188 june 280 dec 312 a) Using a four-month moving average, determine the one-step-ahead forecast for Julythrough December 2013.b) Using a four-month moving average, determine the two-step-ahead forecast for Julythrough December 2013.c) Obtain the MAD for the forecasts obtained in the above sections. Which method gavebetter results? Based on forecasting theory, which method should have given betterresults?The Monthly demand for unit manufactured by the ABC Company has been as follows: Units 250 290 240 280 300 270 290 Month January February March April May June July a.use a four-week weighted moving average to forecast the units of month august by using weights of 40%, 30%, 20% & 10% respectively. b. use exponential smoothing with α=0.3 to forecast the units of month august. c. calculate the mad & mse (use exponential smoothing method).
- Calculate Karl Pearson's coeffcient of skewness from the following data:Weekly Sales (Ksh) 10-12 12-14 14-16 16-18 18-20 20-22 22-24 24-26Number of Companies 12 18 35 42 50 30 8 4Price information for selected foods for 2010 and 2018 is given in the table. Price Quantity Item 2010 2018 2010 2018 Cabbage (pound) $ 0.06 $ 0.05 2,000 1,500 Carrots (bunch) 0.10 0.12 200 200 Peas (quart) 0.20 0.18 400 500 Endive (bunch) 0.15 0.15 100 200 Compute a simple price index for each of the four items. Use 2010 as the base period. (Round your answers to 2 decimal places.)Suppose these data show the number of gallons of gasoline sold by a gasoline distributor in Bennington, Vermont, over the past 12 weeks. Week Sales (1,000sof gallons) 1 18 2 22 3 20 4 24 5 19 6 17 7 22 8 20 9 24 10 22 11 17 12 24 (a) Using a weight of 1 2 for the most recent observation, 1 3 for the second most recent observation, and 1 6 for third most recent observation, compute a three-week weighted moving average for the time series. (Round your answers to two decimal places.) Week Time SeriesValue Weighted MovingAverage Forecast 1 18 2 22 3 20 4 24 5 19 6 17 7 22 8 20 9 24 10 22 11 17 12 24 (b) Compute the MSE for the weighted moving average in part (a). MSE = Do you prefer this weighted moving average to the unweighted moving average? The MSE for the unweighted moving average is 10.91. The unweighted moving average is preferred because it has a larger…
- Refer to the gasoline sales time series data in the given table. Week Sales (1,000s of gallons) 1 17 2 23 3 14 4 25 5 17 6 16 7 22 8 19 9 21 10 19 11 17 12 23 (a) Compute four-week and five-week moving averages for the time series. Do not round intermediate calculations. If required, round your answers to two decimal places. Week Sales 4-WeekMovingAverage 5-WeekMovingAverage 1 17 2 23 3 14 4 25 5 17 6 16 7 22 8 19 9 21 10 19 11 17 12 23 (b) Compute the MSE for the four-week and five-week moving average forecasts. Do not round intermediate calculations. If required, round your answers to two decimal places. MSE for four-week moving average = MSE for five-week moving average = (c) What appears to be the best number of weeks of past data (three, four, or five) to use in the moving average computation? Consider that the MSE for the…During the past five months the emergency room at the new district Hospital has observed the number of patients during the weekend (Friday through Sunday). They typically experience greater patient traffic on weekends than during the week. WEEK NO. OF PATIENTS 1 105 2 119 3 122 4 128 5 117 6 136 7 141 8 126 9 143 10 140 a) Compute a weighted three-period moving average forecast, using weights of 3, 2, and 1 for the most recent, next recent, and most distant data. b) What are the MAD, MSE and the MPE for this method? c) If the company decided to forecast using exponential smoothing with value of alpha =.3, what is the forecast in month 11? (use 2 decimal places)Table 1 HPF Demand in the last 12 periods Period Month Demand in '000 Period Month Demand in '000 1 January 37 7 July 43 2 February 40 8 August 47 3 March 41 9 September 56 4 April 37 10 October 52 5 May 45 11 November 55 6 June 50 12 December 54 The manager of the company wants to be certain enough OFC01 are available to complete orders promptly and they have adequate inventory in stock. During the last meeting, a number of forecast techniques have been discussed: Simple moving average n = 4 Weighted moving average with n=4 with the following weights from most recent periods: 0.4, 0.3, 0.2, 0.1 Exponential Smoothing with alpha = 0.2 Linear trend The manager would like to ascertain the best tools that he and his team can effectively manage the production processes. Among the above forecasting methods, which method should be used to forecast the demand for this product? Why? The…