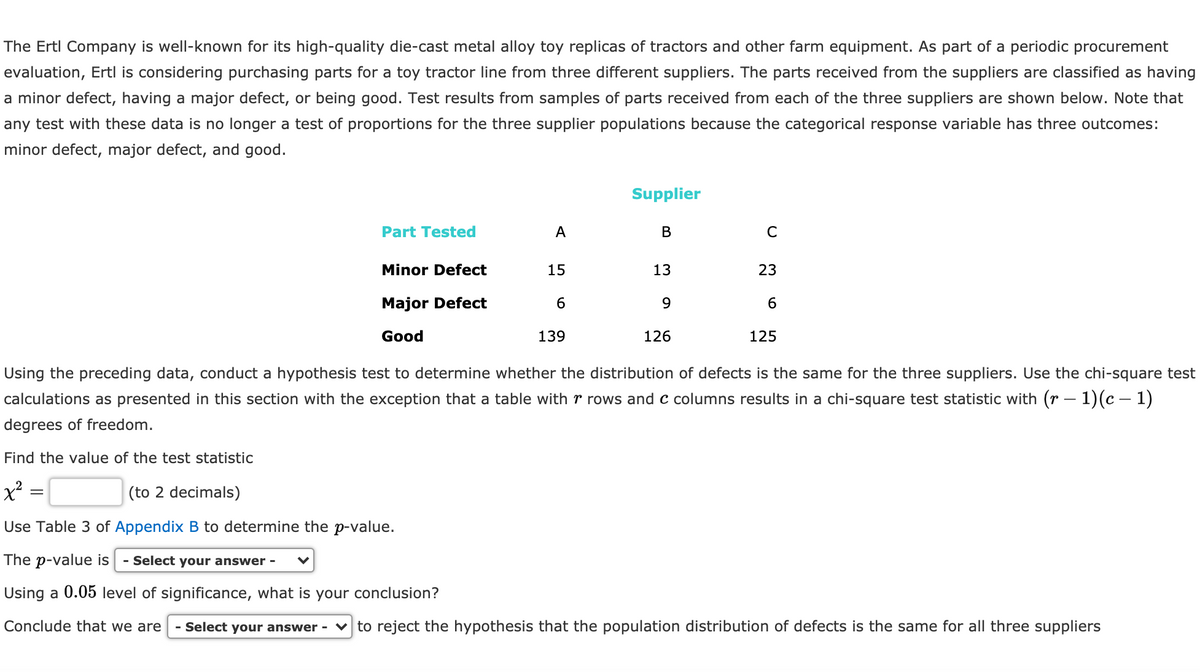
The Ertl Company is well-known for its high-quality die-cast metal alloy toy replicas of tractors and other farm equipment. As part of a periodic procurement evaluation, Ertl is considering purchasing parts for a toy tractor line from three different suppliers. The parts received from the suppliers are classified as having a minor defect, having a major defect, or being good. Test results from samples of parts received from each of the three suppliers are shown below. Note that any test with these data is no longer a test of proportions for the three supplier populations because the categorical response variable has three outcomes: minor defect, major defect, and good. Supplier Part Tested A В C Minor Defect 15 13 23 Major Defect 6 Good 139 126 125 Using the preceding data, conduct a hypothesis test to determine whether the distribution of defects is the same for the three suppliers. Use the chi-square test calculations as presented in this section with the exception that a table with r rows and c columns results in a chi-square test statistic with (r – 1)(c – 1) degrees of freedom. Find the value of the test statistic
The Ertl Company is well-known for its high-quality die-cast metal alloy toy replicas of tractors and other farm equipment. As part of a periodic procurement evaluation, Ertl is considering purchasing parts for a toy tractor line from three different suppliers. The parts received from the suppliers are classified as having a minor defect, having a major defect, or being good. Test results from samples of parts received from each of the three suppliers are shown below. Note that any test with these data is no longer a test of proportions for the three supplier populations because the categorical response variable has three outcomes: minor defect, major defect, and good. Supplier Part Tested A В C Minor Defect 15 13 23 Major Defect 6 Good 139 126 125 Using the preceding data, conduct a hypothesis test to determine whether the distribution of defects is the same for the three suppliers. Use the chi-square test calculations as presented in this section with the exception that a table with r rows and c columns results in a chi-square test statistic with (r – 1)(c – 1) degrees of freedom. Find the value of the test statistic

MATLAB: An Introduction with Applications
6th Edition
ISBN:9781119256830
Author:Amos Gilat
Publisher:Amos Gilat
Chapter1: Starting With Matlab
Section: Chapter Questions
Problem 1P

Related questions
Question
Transcribed Image Text:The Ertl Company is well-known for its high-quality die-cast metal alloy toy replicas of tractors and other farm equipment. As part of a periodic procurement
evaluation, Ertl is considering purchasing parts for a toy tractor line from three different suppliers. The parts received from the suppliers are classified as having
a minor defect, having a major defect, or being good. Test results from samples of parts received from each of the three suppliers are shown below. Note that
any test with these data is no longer a test of proportions for the three supplier populations because the categorical response variable has three outcomes:
minor defect, major defect, and good.
Supplier
Part Tested
A
В
Minor Defect
15
13
23
Major Defect
6.
6.
Good
139
126
125
Using the preceding data, conduct a hypothesis test to determine whether the distribution of defects is the same for the three suppliers. Use the chi-square test
calculations as presented in this section with the exception that a table with r rows and c columns results in a chi-square test statistic with (r – 1)(c – 1)
degrees of freedom.
Find the value of the test statistic
x² =
(to 2 decimals)
Use Table 3 of Appendix B to determine the p-value.
The p-value is
- Select your answer -
Using a 0.05 level of significance, what is your conclusion?
Conclude that we are
- Select your answer - v to reject the hypothesis that the population distribution of defects is the same for all three suppliers
Expert Solution
This question has been solved!
Explore an expertly crafted, step-by-step solution for a thorough understanding of key concepts.

This is a popular solution!

Trending now
This is a popular solution!

Step by step
Solved in 2 steps

Knowledge Booster


Learn more about
Need a deep-dive on the concept behind this application? Look no further. Learn more about this topic, statistics and related others by exploring similar questions and additional content below.Recommended textbooks for you
MATLAB: An Introduction with Applications
Statistics
ISBN:
9781119256830
Author:
Amos Gilat
Publisher:
John Wiley & Sons Inc

Probability and Statistics for Engineering and th…
Statistics
ISBN:
9781305251809
Author:
Jay L. Devore
Publisher:
Cengage Learning

Statistics for The Behavioral Sciences (MindTap C…
Statistics
ISBN:
9781305504912
Author:
Frederick J Gravetter, Larry B. Wallnau
Publisher:
Cengage Learning
MATLAB: An Introduction with Applications
Statistics
ISBN:
9781119256830
Author:
Amos Gilat
Publisher:
John Wiley & Sons Inc
Probability and Statistics for Engineering and th…
Statistics
ISBN:
9781305251809
Author:
Jay L. Devore
Publisher:
Cengage Learning
Statistics for The Behavioral Sciences (MindTap C…
Statistics
ISBN:
9781305504912
Author:
Frederick J Gravetter, Larry B. Wallnau
Publisher:
Cengage Learning

Elementary Statistics: Picturing the World (7th E…
Statistics
ISBN:
9780134683416
Author:
Ron Larson, Betsy Farber
Publisher:
PEARSON

The Basic Practice of Statistics
Statistics
ISBN:
9781319042578
Author:
David S. Moore, William I. Notz, Michael A. Fligner
Publisher:
W. H. Freeman

Introduction to the Practice of Statistics
Statistics
ISBN:
9781319013387
Author:
David S. Moore, George P. McCabe, Bruce A. Craig
Publisher:
W. H. Freeman