10.27. The widths of contact windows in certain CMOS circuit chips have a design specification of 3.5 um (see Phadke et al., The Bell System Technical Journal, 1983, for details.) Postetch window widths of test specimens were as follows: 3.21, 2.49, 2.94, 4.38, 4.02, 3.82, 3.30, 2.85, 3.34, 3.91 Can we reject the hypothesis that the design specification is being met, at the 5% significance level? What assumptions are necessary for this test to be valid?
Q: An artide in the IEEE Transactions on Components, Hybrids, and Manufacturing Technology (Vol. 15,…
A: Solution: From the given information,
Q: 2. The absorbance measurement rates of three equivalent spectrophotometers used in an analysis…
A: We have used the excel data analysis tool to run the ANOVA analysis.
Q: An article reports on an experiment in which each of five groups consisting of six rats was put on a…
A: Given: Number of observations in each level r= 6 rats Number of levels k=5 Treatment: Types of…
Q: An artide in the IEEE Transactions on Components, Hybrids, and Manufacturing Technology (Vol. 15,…
A:
Q: The following information is obtained from two independent samples selected from two populations. n…
A: Given,n1=250n2=240x¯1=5.35x¯2=4.42σ1=1.65σ2=1.63
Q: To test for any significant difference in the number of hours between breakdowns for four machines,…
A: As per our guidelines, we are allowed to answer first three sub-parts only. Here, part a contains…
Q: 2. An experiment was conducted to determine the effect of four different types of tips in a hardness…
A:
Q: Consider a study where students are measured on whether they had an internship during their time at…
A: The chi square test is used to find whether there is an association between the categorical…
Q: On the proposal of the OCTA Research that 90 percent of the vaccines should be for| Metro Manila ++…
A: Ghhddggg
Q: The article "Hydrogeochemical Characteristics of Groundwater in a Mid-Western Coastal Aquifer…
A: Since you have posted a question with multiple sub-parts, we will solve first three sub-parts for…
Q: 2. The following data give the household power (in kW.) usage of two areas in Selangor. 22.1 Kajang…
A: There are two independent samples which are Kajang and Bangi. We have to test whether there is a…
Q: Suppose the following table was generated from the sample data of 20 teachers relating annual salary…
A: Here Given Intercept 39356.558109 + 759.880847(Z) here Z=0 FOR FEMALE AND Z=1 FOR MALE
Q: A sample of 77 individuals workings at the particular office was selected and rhe noise level…
A: To organize the data first make a frequency table. To make the frequency table first arrange the…
Q: Siegel (1990) found that elderly people who owned dogs were less likely to pay visits to their…
A:
Q: (a) Discuss the best suited measures of association under various measurement scales. A 20-year…
A: The odd's ratio is calculated by number of affected people divided by the number of non affected…
Q: The number of contaminating particles on a silicon waferprior to a certain rinsing process was…
A:
Q: The accompanying frequency distribution on depositedenergy (mJ) was extracted from the article…
A:
Q: An experiment was conducted in order to determine if cerebral blood flow in human beings can be…
A: We need to fit the given dataset into a quadratic equation of the form: y=a+bx+cx2 and then…
Q: The Tietjen and Moore paper gives the following set of 8 mass spectrometer measurements on a uranium…
A:
Q: The article "Solid-Phase Chemical Fractionation of Selected Trace Metals in Some Northern Kentucky…
A:
Q: To test for any significant difference in the number of hours between breakdowns for four machines,…
A: a. The data represent the results of a test for any significance difference in the number of hours…
Q: The article “Hydrogeochemical Characteristics of Groundwater in a Mid-Western Coastal Aquifer…
A: Note: Hi! Thanks for posting the question. Since there are more than three sub-part questions, we…
Q: Dr. Romanoff reported the following in a journal: “F (5, 106) = 10.09, p = .04.” Should Dr.…
A: It is given that p- value is 0.04 and the level of significance is 0.05.
Q: 10.27) The widths of contact windows in certain CMOS circuit chips have a design specification of…
A: Given data: Significance level = 5% Sample size = 10
Q: Listed below are the lead concentrations in muμg/g measured in different traditional medicines. Use…
A: Given information- Sample size, n = 10 Significance level, α = 0.01 Now we have to find sample…
Q: For an ARIMA(O,1,1) model, the critical value (or rejection region value) that the test statistic,…
A: For an autoregressive integrated moving average model, ARIMA(0,1,1) the order of the auto regressive…
Q: The control limits for a 3-sigma c chart with n=2 when the process average is equal to 8…
A: From the given information, n=2 c¯=8 The 3 sigma control limits for c chart are: LCL=c¯-3c¯…
Q: 9.2.6 The British Department of Transportation studied to see if people avoid driving on Friday the…
A: Solution: Step 1: From the provided data we have the computations as below: 6th 13th di…
Q: An article reported data from a study in which both a baseline gasoline mixture and a reformulated…
A: Scatter plot: Excel Procedure: Enter the Age and Baseline in Excel>Select the Age and…
Q: A sample of a certain population was investigated in relation to salt consumption daily, obtaining…
A: Pop Cons(g) A 10 B 13 C 17 D 9 E 8 F 11 G 13 H 7
Q: Suppose a random sample of 320 students was asked to indicate which of 4 candy 'items' they…
A: Chi square χ2 test: Chi square test is used to test whether the distributions of categorical…
Q: Use the effect size 0.47 to answer the following regarding a test of H0: mu1-mu2= 0 (using the .05…
A: Effect size, d = 0.47 Here, our null hypothesis is, H0:δ=0 v.s. H1:δ≠0 n1 = 50 and n2 = 150. Level…
Q: The following sample data give the flexural strength (MPa) for concrete beams of a certain type.…
A: The data values given are: 7.3, 6.3, 6.8, 7.0, 7.6, 6.8, 7.0, 6.3, 7.9, 9.0, 7.8, 9.7, 7.8, 11.6,…
Q: An artidle in the IEEE Transactions on Components, Hybrids, and Manufacturing Technolo experiment in…
A: By using one way ANOVA for a single factor,
Q: Listed below are the lead concentrations in muμg/g measured in different traditional medicines. Use…
A:
Q: Listed below are the lead concentrations in muμg/g measured in different traditional medicines. Use…
A: Since the population standard deviation is unknown, the appropriate test is one sample t-test. The…
Q: An X control chart with three - sigma control limits has UCL = 47.75 and LCL = 42.71 . Suppose the…
A:
Q: An experiment is designed to determine the effect of four different types of tips in a hardness…
A: Calculate the row and column totals for the given table as- 1 2 3 4 Row totals 1 9.3 9.4 9.6…
Q: Assume a univariate quantitative data set, which contains fifty observations, has been organized by…
A: From the given information, cf1=9rf2=0.04f3=1 There are 50 observations. By adding 20 more…
Q: The following sample data reflect shipments received by a large firm from three different vendors…
A: There are two categorical variables which are quality and vendor. We have to test whether quality is…
Q: A sample of 12 radon detectors of a certain type was selected, and each was exposed to 100 pCi/L of…
A:
Q: Mendel counted 4000 peas from a dihybrid cross and predicted a 9:3:3:1 phenotypic ratio with the…
A: We have to perform chi square goodness of fit test.
Q: Following are the protein contents measured in two types of species: Species 1: 0.72 1.12 0.81 0.89…
A: Given data is appropriate for testing of hypothesis to test t-test for difference of means. Because…
Q: An article reports the following values for soil heat flux of eight plots covered with coal dust.…
A: Given that the mean soil heat flux for plots covered only with grass is 29 Claim : The coal dust is…
Q: The accompanying summary data on skeletal-muscle CS activity (nmol/min/mg) appeared in an article.…
A: Given to us that; n1=10, x¯1=46.28, s1=7.16n2=8, x¯2=47.41, s2=5.59n3=10, x¯3=58.34, s3=8.43 We know…
Q: The article “Calibration of an FTIR Spectrometer” (P. Pankratz, Statistical Case Studies for…
A:
Q: Given the following data and using Jamovi, test (at an alpha of 0.05) whether type of music…
A: Repeated measure ANOVA is one type of ANOVA.
Q: The better-selling candies are often high in calories. Assume that the following data show the…
A: For the given data and the hypothesis we should carry out a single factor ANOVA and calculate the…
Q: 55.3 55.3 55.3 55.9 55.9 55.9 55.9 56.1 56.1 56.1 56.1 56.1 56.1 56.8 56.8 57 57 57…
A: Summary means, the entire information in some shirt nites. In statistics, summary statistics means…
Q: sto ave 12.72 (M4) The authors of the paper "Serum Zinc Levels of Cord Blood: Relation to Birth…
A: The provided information are:
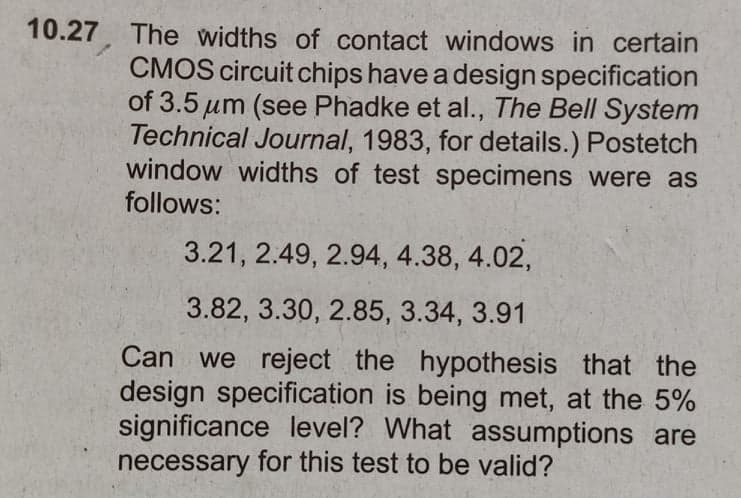
The widths of contact windows in certain CMOS circuit chips have a design specification of 3.5 μm (see Phadke et al., The Bell System Technical Journal, 1983, for details.) Postetch window widths of test specimens were as follows:
3.21, 2.49, 2.94, 4.38, 4.02, 3.82, 3.30, 2.85, 3.34, 3.91
Can we reject the hypothesis that the design specification is being met, at the 5% significance level? What assumptions are necessary for this test to be valid?l
Step by step
Solved in 3 steps with 3 images
- The number of contaminating particles on a silicon waferprior to a certain rinsing process was determined for eachwafer in a sample of size 100, resulting in the followingfrequencies:Number of particles 0 1 2 3 4 5 6 7Frequency 1 2 3 12 11 15 18 10Number of particles 8 9 10 11 12 13 14Frequency 12 4 5 3 1 2 1a. What proportion of the sampled wafers had at leastone particle? At least five particles?b. What proportion of the sampled wafers had betweenfive and ten particles, inclusive? Strictly between fiveand ten particles?c. Draw a histogram using relative frequency on thevertical axis. How would you describe the shape of thehistogram?The table below summarizes data from a survey of a sample of women. Using a 0.01significance level, and assuming that the sample sizes of 800 men and 300 women are predetermined, test the claim that the proportions of agree/disagree responses are the same for subjects interviewed by men and the subjects interviewed by women. Does it appear that the gender of the interviewer affected the responses of women? Gender of Interviewer Man Woman Women who agree 498 247 Women who disagree 302 53 Compute the test statistic, rounding to three decimal places. Find the critical value(s). (Round to three decimal places) What is the conclusion based on the hypothesis test?The article “Calibration of an FTIR Spectrometer” (P. Pankratz, Statistical Case Studies for Industrial and Process Improvement, SIAM-ASA, 1997: 19–38) describes the use of a spectrometer to make five measurements of the carbon content (in ppm) of a certain silicon wafer whose true carbon content was known to be 1.1447 ppm. The measurements were 1.0730, 1.0825, 1.0711, 1.0870, and 1.0979. a) Is it possible to estimate the uncertainty in these measurements? If so, estimate it. If not, explain why not. b) Is it possible to estimate the bias in these measurements? If so, estimate it. If not, explain why not.
- Using all 1991 birth records in the computerized national birth certificate registry compiled by the National Center for Health Statistics (NCHS), statisticians Traci Clemons and Marcello Pagano found that the birth weights of babies in the United States are not symmetric ("Are babies normal?" The American Statistician, Nov 1999, 53:4). However, they also found that when infants born outside of the "typical" 37-43 weeks and infants born to mothers with a history of diabetes are excluded, the birth weights of the remaining infants do follow a Normal model with mean μ = 3432 g and standard deviation σ = 482 g. The following questions refer to infants born from 37 to 43 weeks whose mothers did not have a history of diabetes.Using all 1991 birth records in the computerized national birth certificate registry compiled by the National Center for Health Statistics (NCHS), statisticians Traci Clemons and Marcello Pagano found that the birth weights of babies in the United States are not symmetric (\"Are babies normal?\" The American Statistician, Nov 1999, 53:4). However, they also found that when infants born outside of the \"typical\" 37-43 weeks and infants born to mothers with a history of diabetes are excluded, the birth weights of the remaining infants do follow a Normal model with mean μ = 3432 g and standard deviation σ = 482 g. The following questions refer to infants born from 37 to 43 weeks whose mothers did not have a history of diabetes. Compute the z-score of an infant who weighs 3762 g. (Round your answer to at least two decimal places.) Approximately what fraction of infants would you expect to have birth weights between 2890 g and 3410 g? (Express your answer as a decimal, not a percent, and…Using all 1991 birth records in the computerized national birth certificate registry compiled by the National Center for Health Statistics (NCHS), statisticians Traci Clemons and Marcello Pagano found that the birth weights of babies in the United States are not symmetric ("Are babies normal?" The American Statistician, Nov 1999, 53:4). However, they also found that when infants born outside of the "typical" 37-43 weeks and infants born to mothers with a history of diabetes are excluded, the birth weights of the remaining infants do follow a Normal model with mean μ = 3402 g and standard deviation σ = 492 g. Let X be the weight of a randomly selected infant born from 37 to 43 weeks whose mother did not have a history of diabetes. What is the distribution of X? X ~ N (,) Please show the following answers to 4 decimal places. If a healthy infant is randomly chosen, find the probability that the birth weight is below 3156 g. If a healthy infant is randomly chosen, find the…
- Using all 1991 birth records in the computerized national birth certificate registry compiled by the National Center for Health Statistics (NCHS), statisticians Traci Clemons and Marcello Pagano found that the birth weights of babies in the United States are not symmetric ("Are babies normal?" The American Statistician, Nov 1999, 53:4). However, they also found that when infants born outside of the "typical" 37-43 weeks and infants born to mothers with a history of diabetes are excluded, the birth weights of the remaining infants do follow a Normal model with mean μ = 3432 g and standard deviation σ = 482 g. The following questions refer to infants born from 37 to 43 weeks whose mothers did not have a history of diabetes.Compute the z-score of an infant who weighs 2903 g. (Round your answer to two decimal places.)−1.10Correct Approximately what fraction of infants would you expect to have birth weights between 3060 g and 4410 g? (Express your answer as a decimal, not a percent, and…The British Department of Transportation studied to see if people avoid driving on Friday the 13th. They did a traffic count on a Friday and then again on a Friday the 13th at the same two locations. The data for each location on the two different dates is in the table. Do the data show that on average fewer people drive on Friday the 13th? Test at the 5% level.Traffic Count Dates 6th 13th 1990, July 137669 135825 1990, July 129699 128891 1991, September 136898 138275 1991, September 138966 139940 1991, December 132021 129640 1991, December 119268 119214 1992, March 131938 131104 1992, March 123306 124760 1992, November 129499 129219 1992, November 138568 135934A simple random sample of heights of 6400Englishmen has a mean of 67.85 inches and SD 2.56 inches, while a simple random sample of heights of 1600 Australians has a mean of 68.55 inches and SD of 2.52 inches. D the data indicate that Australians are, on the average, taller than Englishmen?