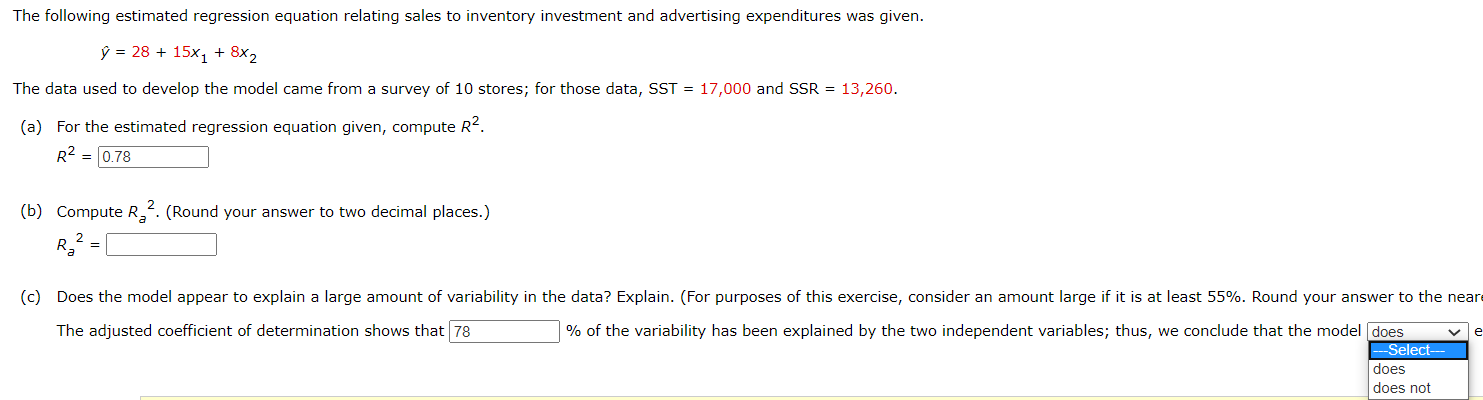
The following estimated regression equation relating sales to inventory investment and advertising expenditures was given. ý = 28 + 15x, + 8x2 The data used to develop the model came from a survey of 10 stores; for those data, SST = 17,000 and SSR = 13,260. (a) For the estimated regression equation given, compute R2. R2 = 0.78 2 (b) Compute R. (Round your answer to two decimal places.) (c) Does the model appear to explain a large amount of variability in the data? Explain. (For purposes of this exercise, consider an amount large if it is at least 55%. Round your answer to the near The adjusted coefficient of determination shows that 78 % of the variability has been explained by the two independent variables; thus, we conclude that the model does Select- does


Correlation
Correlation defines a relationship between two independent variables. It tells the degree to which variables move in relation to each other. When two sets of data are related to each other, there is a correlation between them.
Linear Correlation
A correlation is used to determine the relationships between numerical and categorical variables. In other words, it is an indicator of how things are connected to one another. The correlation analysis is the study of how variables are related.
Regression Analysis
Regression analysis is a statistical method in which it estimates the relationship between a dependent variable and one or more independent variable. In simple terms dependent variable is called as outcome variable and independent variable is called as predictors. Regression analysis is one of the methods to find the trends in data. The independent variable used in Regression analysis is named Predictor variable. It offers data of an associated dependent variable regarding a particular outcome.


Trending now
This is a popular solution!

Step by step
Solved in 2 steps with 3 images


