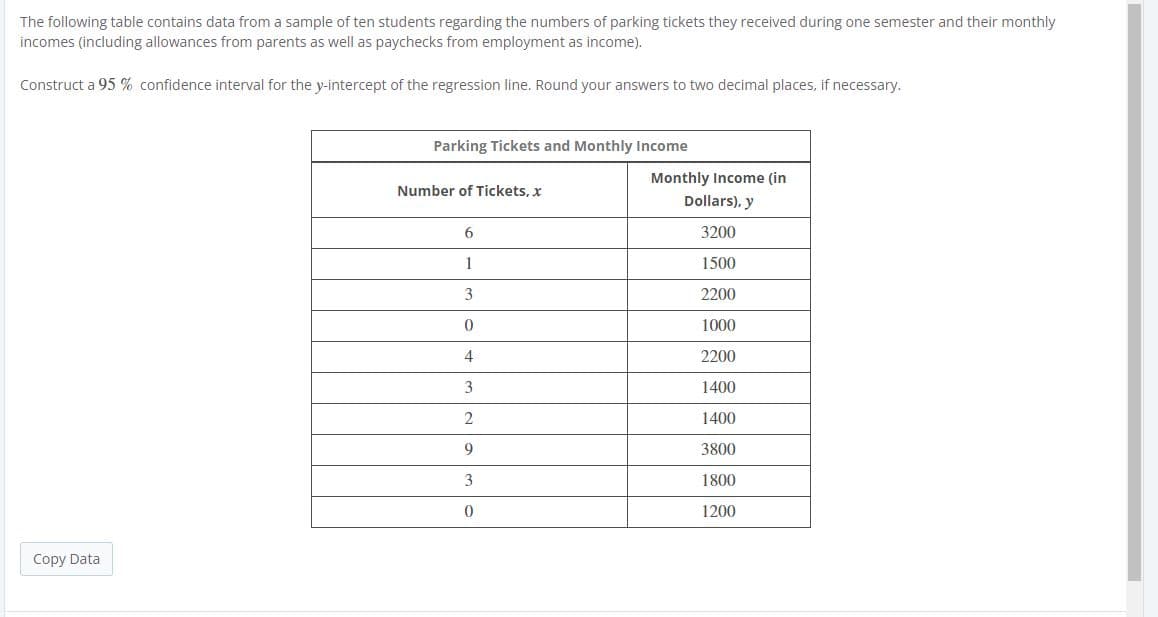
The following table contains data from a sample of ten students regarding the numbers of parking tickets they received during one semester and their monthly incomes (including allowances from parents as well as paychecks from employment as income). Construct a 95 % confidence interval for the y-intercept of the regression line. Round your answers to two decimal places, if necessary. Parking Tickets and Monthly Income Monthly Income (in Number of Tickets, x Dollars), y 3200 1 1500 3 2200 1000 4 2200 3 1400 1400 3800 3 1800 1200 Copy Data


Q: The following data were collected during a study of consumer buying patterns: Observation y 1 15 74…
A: (1) Use EXCEL to construct the scatter plot. EXCEL procedure: Go to EXCEL Go to Insert menu…
Q: Below is the output for the regression analysis for percent of birth to teenage mothers (y) and ACT…
A: From the output, the slope is -1.65 and the intercept is 45.76.
Q: he following data shows the dexterity test scores of five assembly-line employees of Dimples Company…
A: Since you have asked multiple questions, we will solve the first question for you. If you want any…
Q: Assume you have noted the following prices for books and the number of pages that each book…
A: 1 The regression output for the given dataset, as obtained in excel, is as follows:…
Q: The following table gives the retail value of a 2004 Corvette Z06 for various odometer readings.…
A: Given data, X Y X*Y X*X Y*Y 13000 46100 599300000 169000000 2125210000 18000 44600…
Q: The following scores were collected by a researcher: Participants Y 8. 12 7. 14 17 3. 18 21 23 6. 1.…
A: Note: " Since you have asked multiple sub-parts, we will solve the first three sub-parts for you. If…
Q: The following table gives the aptitude test scores and productivity indices of 10 workers selected…
A:
Q: The final test and exam averages for 20 randomly selected students taking a course in engineering…
A: Since you have posted a question with multiple sub-parts, we will solve first three sub- parts for…
Q: The following data on r = the line speed (feet per minute) and y = the number of defective parts…
A: Given data and required calculation is shown below
Q: An electronics company is looking to develop a regression model to predict the number of units sold…
A: Since the regression models always take numerical values as the input; therefore, convert the column…
Q: a) What kind of relationship exist between the exam scores and the clas sizes? Interpret the…
A: The regression line is given by score = 95 -1.2Size There is a negative relationship between the…
Q: Computer output from a least-squares regression analysis based on a sample of size 17 is shown in…
A: It is given that output from a least-square regression analysis and the sample size is 17.
Q: Consider the set of ordered pairs shown below. Assuming that the regression equation is y = 1.334…
A:
Q: A sample of n = 120 scores were presented using the Tenacity (authority) scores to the following…
A: Given info: The p value for the multiple regression analysis for 1. tenacity and voice is 0.001.…
Q: A sample of n= 120 scores were presented using the tendency(authority) scores to the following…
A: We want to tell you we reject or can't reject the null hypothesis. Given ɑ=0.05
Q: A sample of n = 120 scores were presented using the Tenacity (authority) scores to the following…
A: Consider a multiple regression analysis for the prediction of tenacity scores on the basis of 5…
Q: Use the following information from a multiple regression analysis. n=15 b1=2 b2=6 Sb1=1.4 Sb2=0.5 a.…
A: Solution: Given information: n= 15 observation k= 2 independent variables b1= 2b2= 6Sb1= 1.4Sb2=…
Q: Run a regression analysis on the following bivariate set of data with y as the response variable. x…
A:
Q: The following table contains data from a sample of eight people regarding the number of bowls of…
A: Solution
Q: Use the information from a simple linear regression given in the table below to calculate a 95%…
A:
Q: Given below are seven observations collected in a regression study on two variables, x (independent…
A: x y 2 12 3 9 6 8 7 7 8 6 7 5 9 2
Q: The following table contains data from a sample of ten students regarding the numbers of parking…
A: Output: From the output,
Q: What is the relationship between the attendance at a major league ball game and the total number of…
A: Since you have posted a question with multiple sub-parts, we will solve the first three sub-parts…
Q: The following data on x = the line speed (feet per minute) and y = the number of defective parts…
A: Obtain the 95% confidence interval for the mean number of defective parts for a line speed of 25…
Q: A statistical program is recommended. Consider the following data for a dependent variable y and two…
A:
Q: The following table contains data from a sample of eight people regarding the number of bowls of…
A: Solution Yo find the 95% confidence interval for the y intercept we will use Excel LOWER ENDPOINT =…
Q: In exercise 12, the following data on x = average daily hotel room rate and y = amount spent on…
A: a) Given that the regression equation is, ŷ = 17.49 + 1.0334x. Given that x=89. Substitute 89…
Q: Run a regression analysis on the following bivariate set of data with y as the response variable. x…
A: Correlation coefficient measures the strength and direction of the linear relationship between two…
Q: The following data were collected from a sample of students on the numbers of times they were tardy…
A: Given data: Number of Tardies, x Final exam grade, y 8 68 6 68 6 67 3 83 2 89 0 89…
Q: Given below are seven observations collected in a regression study on two variables, x (independent…
A: Regression is a numerical relationship between an explanatory variable and a response variable. In…
Q: Construct a 95 % confidence interval for the slope of the regression line. Round your answers to two…
A: Solution Confidence interval by using excal
Q: The following data were collected from a sample of students on the numbers of times they were tardy…
A: Confidence interval for slope is given by, b1 ± tα/2,n-2*Sb1 where , b1 is estimate of slope Sb1 is…
Q: If a p-value reported in the Excel linear regression output associated with a particular variable is…
A: Given that: A p-value associated with a particular variable is 0.007. The objective is to identify…
Q: A sample of n= 120 scores were presented using the tendency(authority) scores to the following…
A: Note: According to Bartleby, expert solve only one question and maximum 3 subpart of the first…
Q: In exercise 7, the data on y = annual sales ($1000s) for new customer accounts and x = number of…
A:
Q: The following is a regression of credit scores based on an individual's age, income, their location…
A: For statement A Since the regression is run on individual and not on city therefore the regression…
Q: The following data are the monthly salaries and the grade point averages for students who obtained…
A: a. The data related to the monthly salaries (y) and the grade point averages (x) for students, who…
Q: Which of the following points is most likely a high-leverage point with respect to a regression of…
A: High- Leverage Point: A point on the scatter plot is said to be a high-leverage point if that point…
Q: Run a regression analysis on the following bivariate set of data with y as the response variable. x…
A: Solution-: Predict what value (on average) for the response variable will be obtained from a value…
Q: An article in the Journal of Sound and Vibration (Vol. 151, 1991, pp. 383-394) described a study…
A: a) Excel Procedure: Enter X and Y in Excel>Data>Data Analysis> ‘Regression’>Select Y…
Q: A linear regression model was fit to a set of data containing 18 observations. The computer output…
A: From the provided information, the sample size is 18. The confidence interval for the slope is…
Q: Using data from 50 clerical workers, a researcher estimates wage = Bo + ß1Education + B2Experience +…
A:
Q: Run a regression analysis on the following bivariate set of data with y as the response variable. x…
A: The regression analysis is conducted here by using EXCEL. The software procedure is given below:…
Q: The following are sample data provided by a movingcompany on the weights of six shipments, the…
A: (a) Excel Procedure: Enter the data for y, x1 and x2 in Excel>Data> Data Analysis.>…
Q: a) construct a 95% confidence interval for the regression coefficient for x1 and interpret its…
A: a. The regression analysis is conducted using EXCEL. The software procedure is given below: Enter…
Q: rite out the regression equation using the information from the table: Variable Est.…
A:
Q: The following table lists the monthly incomes (in hundreds of dollars) and the monthly rents paid…
A: Note: Hey, since there are multiple subparts posted, we will answer first three subparts. If you…
Q: Below is the output for regression equation for a realtor with 2 independent variables of square…
A:
Q: The following data on price ($) and the overall score for 6 stereo headphones that were tested by…
A: For the given data FIND a. Does the t test indicate a significant relationship between price and…
Q: Construct a 95% confidence interval for the average value of y for the following data. Use x = 25,…
A: Solution: Given information: The estimated regression equation is y^= 16.920+0.160x Se= 4.77…


Trending now
This is a popular solution!

Step by step
Solved in 3 steps with 2 images

- The following table contains data from a sample of ten students regarding the numbers of parking tickets they received during one semester and their monthly incomes (including allowances from parents as well as paychecks from employment as income). Construct a 95%95% confidence interval for the y-intercept of the regression line. Round your answers to two decimal places, if necessary. Parking Tickets and Monthly Income Number of Tickets, x Monthly Income (in Dollars), y 7 2800 3 2300 8 3400 10 3800 10 3800 2 1600 6 2100 5 1800 5 2500 5 2000The following table lists the monthly incomes (in hundreds of dollars) and the monthly rents paid (in hundreds of dollars) by a sample of six families. Monthly Income Monthly Rent 24 7.0 16 4.5 19 6.5 31 11.6 10 4.5 27 8.5 1.The 99% confidence interval for the slope, B, of the population regression line is (2 decimals): __________________________________________ 2. The null hypothesis is that the slope of the population regression line of monthly rent on monthly income is zero and the alternative hypothesis is that the slope of this population regression line is greater than zero. The significance level is 1%. What is the critical value of t (3 decimals)? __________________________________________ 3. The null hypothesis is that the slope of the population regression line of monthly rent on monthly income is zero and the alternative hypothesis is that the slope of this population regression line is greater than zero. The significance level is 1%. What is…A sample of n = 120 scores were presented using the Tenacity (authority) scores to the following predictors: age gender, SES, tone of voice, and clothing. Using a two-tailed test at the 0.05 level of significance, a multiple regression analysis was computed: 1. tenacity and age (pvalue = 0.043); 2. tenacity and gender (pvalue = 0.102); 3. tenacity and SES (pvalue = 0.40); Using the pvalue, provide your DECISION, whether: Accept Ho or Reject Ho, Accept Ha
- Using the regression results in column (1):a. Is the college–high school earnings difference estimated from thisregression statistically significant at the 5% level? Construct a 95%confidence interval of the difference.b. Is the male–female earnings difference estimated from this regressionstatistically significant at the 5% level? Construct a 95% confidenceinterval for the differencA researcher developed a regression model to predict the cost of a meal based on the summated rating (sum of ratings for food, decor,and service) and the cost per meal for 12 restaurants. The results of the study show that b1=1.4379 and Sb1=0.1397. a. At the 0.05 level of significance, is there evidence of a linear relationship between the summated rating of a restaurant and the cost of a meal? b. Construct a 95% confidence interval estimate of the population slope, β1. a. Determine the hypotheses for the test. Choose the correct answer below. A. H0: β1=0 H1: β1≠0 B. H0: β0≤0 H1: β0>0 C. H0: β1≤0 H1: β1>0 D. H0: β0≥0 H1: β0<0 E. H0: β1≥0 H1: β1<0 F. H0: β0=0 H1: β0≠0 Compute the test statistic. The test statistic is ? (Round to two decimal places as needed.) Determine the critical value(s). The critical value(s) is(are) ? (Use a comma to separate answers as needed.…In Exercises, presume that the assumptions for regression inferences are met.Crown-Rump Length. Following are the data on age of fetuses and length of crown-rump from Exercise. x 10 10 13 13 18 19 19 23 25 28 y 66 66 108 106 161 166 177 228 235 280 a. Determine a point estimate for the mean crown-rump length of all 19-week-old fetuses.b. Find a 90% confidence interval for the mean crown-rump length of all 19-week-old fetuses.c. Find the predicted crown-rump length of a 19-week-old fetus.d. Determine a 90% prediction interval for the crown-rump length of a 19-week-old fetus.ExerciseApplying the Concepts and SkillsIn Exercises, we repeat the information from Exercises. For each exercise here, discuss what satisfying Assumptions 1–3 for regression inferences by the variables under consideration would mean.
- As concrete cures, it gains strength. The following data represent the 7-day and 28-day strength in pounds per square inch (psi) of a certain type of concrete 7-Day Strength (psi), x 3340 3390 3380 2300 2480 28-Day Strength (psi), y 4630 5220 5020 4070 4120 Construct a 95% confidence interval about the slope of the true least-squares regression line. Lower bound:______. (Round to three decimal places as needed.) Upper bound:________.(Round to three decimal places as needed.)A sample of n = 120 scores were presented using the Tenacity (authority) scores to the following predictors: age gender, SES, tone of voice, and clothing. Using a two-tailed test at the 0.05 level of significance, a multiple regression analysis was computed: 1. tenacity and age (pvalue = 0.043) Using the pvalue, provide your DECISION, whether: Accept Ho or Reject Ho, Accept HaA sample of n = 120 scores were presented using the Tenacity (authority) scores to the following predictors: age gender, SES, tone of voice, and clothing. Using a two-tailed test at the 0.05 level of significance, a multiple regression analysis was computed: 1. tenacity and voice (pvalue = 0.001); 2. tenacity and clothing (pvalue = 0.017); Using the pvalue, provide your DECISION, whether: Accept Ho or Reject Ho, Accept Ha
- A sample of n = 120 scores were presented using the Tenacity (authority) scores to the following predictors: age gender, SES, tone of voice, and clothing. Using a two-tailed test at the 0.05 level of significance, a multiple regression analysis was computed: 1. tenacity and age (pvalue = 0.043); 2. tenacity and gender (pvalue = 0.102); 3. tenacity and SES (pvalue = 0.40); 4. tenacity and voice (pvalue = 0.001); 5. tenacity and clothing (value = 0.017); SOrs Using the pvalue, provide your DECISION, whether:Accept Ho or Reject Ho, Accept HaAn Internet retailer would like to investigate the relationship between the amount of time in minutes a purchaser spends on its Web site and the amount of money he or she spends on an order. The table to the right shows the data from a random sample of 12customers. Construct a 90% confidence interval for the regression slope. Order Size Time Order Size 17 $73 3 $60 14 $25 38 $365 26 $96 7 $126 22 $196 38 $158 1 $51 25 $76 12 $39 8 $252 Construct a 90% confidence interval for the slope. LCL= UCL= (Round to three decimal places as needed.)A sample of n = 120 scores were presented using the Tenacity (authority) scores to the following predictors: age gender, SES, tone of voice, and clothing. Using a two-tailed test at the 0.05 level of significance, a multiple regression analysis was computed: 5. tenacity and clothing (value = 0.017); SOrs Using the pvalue, provide your DECISION, whether: Accept Ho or Reject Ho, Accept Ha