
Practical Management Science
6th Edition
ISBN: 9781337406659
Author: WINSTON, Wayne L.
Publisher: Cengage,
expand_more
expand_more
format_list_bulleted
Related questions
Question
- The following table shows activities with duration, dependency, dependency type, and the number of workers from one small segment of a project network. Draw the segment of the network diagram and then: (a) Show the resource usage (chart) if activities A, B, and C start on day one; (b) Show the new network diagram and the resource usage (chart) when resources are leveled after applying appropriate slack times.
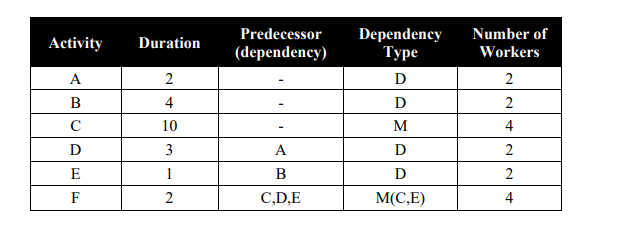

Transcribed Image Text:**Project Activity Table**
This table outlines the activities involved in a project, including their durations, dependencies, types of dependency, and the number of workers required for each activity.
| **Activity** | **Duration** | **Predecessor (Dependency)** | **Dependency Type** | **Number of Workers** |
|--------------|--------------|------------------------------|---------------------|----------------------|
| A | 2 | - | D | 2 |
| B | 4 | - | D | 2 |
| C | 10 | - | M | 4 |
| D | 3 | A | D | 2 |
| E | 1 | B | D | 2 |
| F | 2 | C,D,E | M(C,E) | 4 |
**Explanation:**
- **Activity**: Represents a task or set of tasks within the project.
- **Duration**: Time required to complete the activity (measured in unspecified time units).
- **Predecessor (Dependency)**: Activities that must be completed before the current activity can begin.
- **Dependency Type**:
- 'D' denotes a direct dependency.
- 'M' indicates a milestone, signifying a major stage or event in the project.
- **Number of Workers**: The workforce needed for the activity.
This table serves as a framework for scheduling and resource allocation within project management.

Transcribed Image Text:The text outlines a task for visualizing project management components using network diagrams and resource charts.
**Task Instructions:**
1. **Data Source:** A table detailing activities within a project network, with elements such as:
- Duration
- Dependency
- Dependency type
- Number of workers involved
2. **Objectives:**
- **Draw the Segment:** Create the segment of the network diagram based on the given data.
- **Initial Resource Usage:**
- **Activity Start:** Depict resource usage in a chart assuming activities A, B, and C commence on the first day.
- **Optimized Resource Usage:**
- Adjust the network diagram and corresponding resource usage chart, incorporating slack times to balance resource deployment effectively.
**Concepts Explained:**
- **Network Diagram:** A visual representation of the sequence of activities that make up a project. It indicates dependencies and critical paths.
- **Resource Usage Chart:** A graph illustrating the allocation of workers over the project timeline. Initially, it reflects unoptimized conditions.
- **Resource Leveling:** Adjusting the project schedule to optimize resource allocation without affecting the project timeline negatively, using slack times to prevent resource overloads.
These diagrams and charts are crucial for project managers to visualize workflows and manage resources efficiently.
Expert Solution
This question has been solved!
Explore an expertly crafted, step-by-step solution for a thorough understanding of key concepts.

This is a popular solution

Trending nowThis is a popular solution!

Step by stepSolved in 2 steps with 3 images

Knowledge Booster

Similar questions
- The project information of the project Automated Warehouse Order Picking System is presented as following. Draw a project network for this project. Compute the early and late activity times and the slack times. Identify the critical path. How many days will the project take? ID A B C D E F G H 80 130 85 95 Activity Define requirements Assign team Design hardware Code software Build & test hardware Develop patent request Test software Integrate systems Predecessor None A A B C C D E (F-S, lag 20d),F,G Time (days) 5 сл сл 5 20 20 10⁰ 15 15 40arrow_forwardNeed help don't understand. Please include answers and explanation.arrow_forwardb) – Draw the Activity-on-Node (AON) diagram using the following representation for every node: Activity Description Expected Time ES EF LS LF Slack C.) Complete the following table, determine the expected time of completion assuming that the project starts at week 0 (zero) and identify the critical path for this project. Demonstrate all your calculations. On Critical Path? Activity Activity Description ES EF LS LF Slack Yes or No Locate new facilities 2 Order furniture Interview prospective staff Hire and train staff 3 4. Remodel facilities Receive and set up furniture Move in and start up 6 7 a) Complete the following table, calculate the project variance and project standard deviation. Demonstrate all your calculations.arrow_forward
- Shown below is the project network diagram for a small office renovation project. The numbers in the nodes are the activity times. What is the slack time for activity A? 7 5 3 0arrow_forwardNeed all pleasearrow_forwardGiven is a Project with network diagram and activity times as shown below. Activity Time (wks) A 13 B 5 Start с 14 A c) The Slack time of Activity C = Blank 3 weeks D D a) The Earliest Start (ES) time of Activity I = Blank 1 weeks 9 b) The Latest Start (LS) time of Activity B = Blank 2 weeks f) The Project Completion time = Blank 6 weeks d) The Earliest Finish (EF) time of Activity H = Blank 4 weeks e) The Latest Finish (LF) time of Activity B = Blank 5 weeks B F E 12 E F LL 17 H G 9 J H 15 - 15 J 2arrow_forward
- Table 3 gives time estimates in weeks for each activity (Durations are Time Expected obtained using PERT) Activity Preceded 1 Order review 2 Order vendor parts 3 Produce standard parts 4 Design custom parts Software development 5 6 Manufacture custom parts 7 Assemble 8 Test Duration 5 15 20 13 18 10 10 5 1 1 1 4 2,3,6 2,5 Resources Ryan Carly Ryan Lauren Connor Ryan Dawn Test Assuming that you have been engaged to programme the project activities indicated in Table 3 and Figure A8.1B (Air Control Project: Time Plan without Resources), USE CCPM (Critical Chain Project Management) to ESTIMATE the project duration by showing each and every stage of your programming process (indicate technical dependency with resources imposed).arrow_forwardFor the following simple seven‐activity project, develop a precedence network, calculate all relevant characteristics of each activity (ES, EF, LS, LF, TF), and calculate the project duration. Then draw a time‐scaled network and under it a labor resource histogram for the ES. Do the same for the LS. In both cases, use the maximum allowable number of workers. Make adjustments to the noncritical activities, within the constraints of the ES and LF and the maximum and minimum workers allowed to provide what you feel is the best labor distribution. Lastly, Explain in detail what do you feel is the biggest problem with the ES and LS configurations, and how has this been alleviated with your solution?arrow_forwardProject Management Homework-Project Crashing Use the following scenario and data to answer all related questions. A community neighborhood association decided to add a swimming pool to the community activity center. The project is divided into the activities listed in the following table. The activity times and costs, both normal and crashed, are given. To finish the project before the summer season starts, the neighborhood has to make time and cost tradeoffs. If the project needs to be finished in 20 weeks, you are required to formulate a linear programming model to decide about how much to crash for each activity. Activity Immediate Predecesso Normal Gs) Cost (5) Cost (5) Crashed Normal Crashed A 4 2 800 1400 B A 5 2 3000 4200 C 6 4 2500 2800 D A, C 7 5 1600 2200 E B, C 5 2 1200 2100 F D 4 3 1300 2100 G E, F 5 3 8200 9000 To answer the following questions, you may want to use the last column of the following table to compute the cost of crashing an activity by one week. Immediate…arrow_forward
- Project Management Homework-Project Crashing Use the following scenario and data to answer all related questions. A community neighborhood association decided to add a swimming pool to the community activity center. The project is divided into the activities listed in the following table. The activity times and costs, both normal and crashed, are given. To finish the project before the summer season starts, the neighborhood has to make time and cost tradeoffs. If the project needs to be finished in 20 weeks, you are required to formulate a linear programming model to decide about how much to crash for each activity. Activity Immediate Predecesso Normal Gs) Cost (5) Cost (5) Crashed Normal Crashed A 4 2 800 1400 B A 5 2 3000 4200 C 6 4 2500 2800 D A, C 7 5 1600 2200 E B, C 5 2 1200 2100 F D 4 3 1300 2100 G E, F 5 3 8200 9000 To answer the following questions, you may want to use the last column of the following table to compute the cost of crashing an activity by one week. Immediate…arrow_forwardA local political campaign must coordinate a number of necessary activities to be prepared for an upcoming election. The following table describes the relationships between these activities that need to be completed, as well as their completion times. Activity Immediate Predecessors Time (weeks) A - 3 B - 6 C A 2 D A 3 E B, C 7 F B 6 G D, E 1 H F 1 a) Develop a project network for this problem. b) Determine the EST, EFT, LST, LFT, and slack for each activity. c) What is the critical path and project completion time?arrow_forward
arrow_back_ios
arrow_forward_ios
Recommended textbooks for you
- Practical Management ScienceOperations ManagementISBN:9781337406659Author:WINSTON, Wayne L.Publisher:Cengage,
 Operations ManagementOperations ManagementISBN:9781259667473Author:William J StevensonPublisher:McGraw-Hill Education
 Operations and Supply Chain Management (Mcgraw-hi...Operations ManagementISBN:9781259666100Author:F. Robert Jacobs, Richard B ChasePublisher:McGraw-Hill Education
 Purchasing and Supply Chain ManagementOperations ManagementISBN:9781285869681Author:Robert M. Monczka, Robert B. Handfield, Larry C. Giunipero, James L. PattersonPublisher:Cengage Learning
 Production and Operations Analysis, Seventh Editi...Operations ManagementISBN:9781478623069Author:Steven Nahmias, Tava Lennon OlsenPublisher:Waveland Press, Inc.
Practical Management Science
Operations Management
ISBN:9781337406659
Author:WINSTON, Wayne L.
Publisher:Cengage,
Operations Management
Operations Management
ISBN:9781259667473
Author:William J Stevenson
Publisher:McGraw-Hill Education
Operations and Supply Chain Management (Mcgraw-hi...
Operations Management
ISBN:9781259666100
Author:F. Robert Jacobs, Richard B Chase
Publisher:McGraw-Hill Education
Purchasing and Supply Chain Management
Operations Management
ISBN:9781285869681
Author:Robert M. Monczka, Robert B. Handfield, Larry C. Giunipero, James L. Patterson
Publisher:Cengage Learning
Production and Operations Analysis, Seventh Editi...
Operations Management
ISBN:9781478623069
Author:Steven Nahmias, Tava Lennon Olsen
Publisher:Waveland Press, Inc.