The owners of a chain of ice cream stores have the business objective of improving the forecast of daily sales so that staffing shortages can be minimized during the summer season. As a starting point, the owners decide linear regression model to predict daily sales based on atmospheric temperature. They select a sample of 15 consecutive days. The results are shown in the accompanying table. Complete parts (a) through (f) below. E Click the icon to view the data table. develop a simple Click the icon to view a table of critical values of the Durbin-Watson statistic. ... a. Assuming a linear relationship, use the least-squares method to compute the regression coefficients b, and b,. b, = (Round to four decimal places as needed.) - X Ice cream sales Day Sales ($1,000) Temperature (°F) 1.52 63 71 2 3 1.68 1.92 75 1.79 2.02 2.36 2.16 2.69 74 76 81 81 7 84 9 10 11 12 13 2.91 88 3.17 90 3.02 3.27 3.42 2.84 2.54 90 93 99 88 83 14 15 Print Done
The owners of a chain of ice cream stores have the business objective of improving the forecast of daily sales so that staffing shortages can be minimized during the summer season. As a starting point, the owners decide linear regression model to predict daily sales based on atmospheric temperature. They select a sample of 15 consecutive days. The results are shown in the accompanying table. Complete parts (a) through (f) below. E Click the icon to view the data table. develop a simple Click the icon to view a table of critical values of the Durbin-Watson statistic. ... a. Assuming a linear relationship, use the least-squares method to compute the regression coefficients b, and b,. b, = (Round to four decimal places as needed.) - X Ice cream sales Day Sales ($1,000) Temperature (°F) 1.52 63 71 2 3 1.68 1.92 75 1.79 2.02 2.36 2.16 2.69 74 76 81 81 7 84 9 10 11 12 13 2.91 88 3.17 90 3.02 3.27 3.42 2.84 2.54 90 93 99 88 83 14 15 Print Done

College Algebra
7th Edition
ISBN:9781305115545
Author:James Stewart, Lothar Redlin, Saleem Watson
Publisher:James Stewart, Lothar Redlin, Saleem Watson
Chapter1: Equations And Graphs
Section: Chapter Questions
Problem 10T: Olympic Pole Vault The graph in Figure 7 indicates that in recent years the winning Olympic men’s...

Related questions
Question
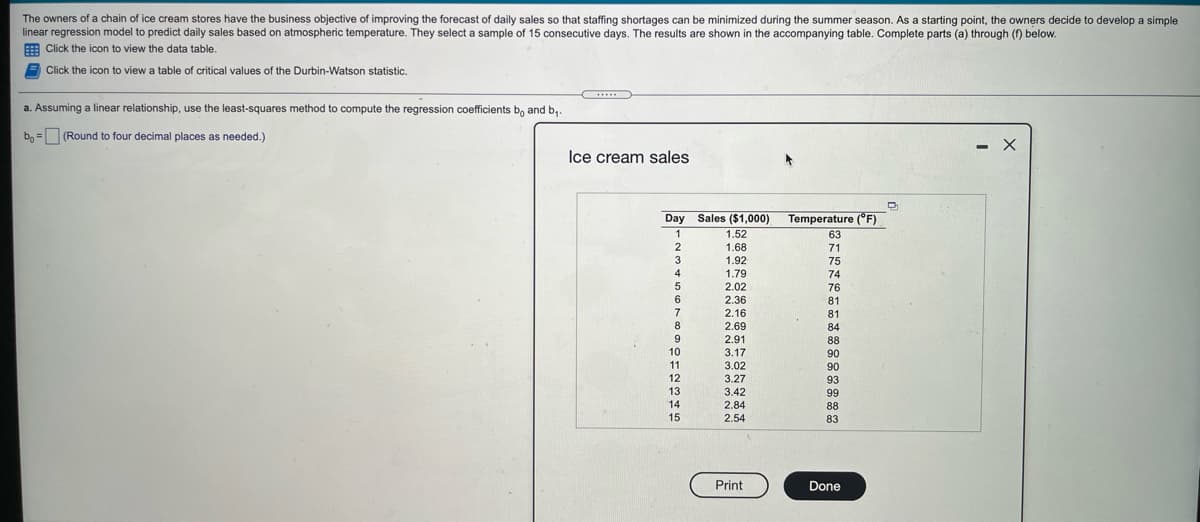
Transcribed Image Text:The owners of a chain of ice cream stores have the business objective of improving the forecast of daily sales so that staffing shortages can be minimized during the summer season. As a starting point, the owners decide
linear regression model to predict daily sales based on atmospheric temperature. They select a sample of 15 consecutive days. The results are shown in the accompanying table. Complete parts (a) through (f) below.
E Click the icon to view the data table.
develop a simple
A Click the icon to view a table of critical values of the Durbin-Watson statistic.
.....
a. Assuming a linear relationship, use the least-squares method to compute the regression coefficients b, and b,.
bo = (Round to four decimal places as needed.)
- X
Ice cream sales
Day Sales ($1,000)
Temperature (°F)
1
1.52
63
1.68
1.92
71
75
1.79
74
5
2.02
76
6
2.36
81
7
2.16
81
8.
9
10
2.69
84
2.91
88
3.17
90
11
3.02
3.27
06
93
12
13
3.42
99
14
2.84
88
15
2.54
83
Print
Done
Expert Solution
This question has been solved!
Explore an expertly crafted, step-by-step solution for a thorough understanding of key concepts.

This is a popular solution!

Trending now
This is a popular solution!

Step by step
Solved in 2 steps with 2 images

Recommended textbooks for you
College Algebra
Algebra
ISBN:
9781305115545
Author:
James Stewart, Lothar Redlin, Saleem Watson
Publisher:
Cengage Learning


Linear Algebra: A Modern Introduction
Algebra
ISBN:
9781285463247
Author:
David Poole
Publisher:
Cengage Learning
College Algebra
Algebra
ISBN:
9781305115545
Author:
James Stewart, Lothar Redlin, Saleem Watson
Publisher:
Cengage Learning
Linear Algebra: A Modern Introduction
Algebra
ISBN:
9781285463247
Author:
David Poole
Publisher:
Cengage Learning

Algebra and Trigonometry (MindTap Course List)
Algebra
ISBN:
9781305071742
Author:
James Stewart, Lothar Redlin, Saleem Watson
Publisher:
Cengage Learning

Glencoe Algebra 1, Student Edition, 9780079039897…
Algebra
ISBN:
9780079039897
Author:
Carter
Publisher:
McGraw Hill

Functions and Change: A Modeling Approach to Coll…
Algebra
ISBN:
9781337111348
Author:
Bruce Crauder, Benny Evans, Alan Noell
Publisher:
Cengage Learning