The owners of a chain of ice cream stores have the business objective of improving the forecast of daily sales so that staffing shortages can be minimized duning the linear regression model to predict daily sales based on atmospheric temperature. They select a sample of 15 consecutive days. The results are shown in the accompanying table. Complete parts (a) through (f) below. staring point, A Click the icon to view the data table. Click the icon to view a table of critical values of the Durbin-Watson statistic. a. Assuming a linear relationship, use the least-squares method to compute the regression coefficients bo and b,. bo = -2.7630 (Round to four decimal places as needed.) - X Ice cream sales b, = (Round to four decimal places as needed.) Temperature (F) Day Sales ($1,000) 1.52 1.68 1.92 63 71 3 75 74 4. 1.79 2.02 2.36 76 81 6. 7. 2.16 2.69 2.91 81 8 84 9 88 10 90 3.17 3.02 3.27 11 90 12 93 99 13 3.42 14 2.84 88 83 15 2.54
The owners of a chain of ice cream stores have the business objective of improving the forecast of daily sales so that staffing shortages can be minimized duning the linear regression model to predict daily sales based on atmospheric temperature. They select a sample of 15 consecutive days. The results are shown in the accompanying table. Complete parts (a) through (f) below. staring point, A Click the icon to view the data table. Click the icon to view a table of critical values of the Durbin-Watson statistic. a. Assuming a linear relationship, use the least-squares method to compute the regression coefficients bo and b,. bo = -2.7630 (Round to four decimal places as needed.) - X Ice cream sales b, = (Round to four decimal places as needed.) Temperature (F) Day Sales ($1,000) 1.52 1.68 1.92 63 71 3 75 74 4. 1.79 2.02 2.36 76 81 6. 7. 2.16 2.69 2.91 81 8 84 9 88 10 90 3.17 3.02 3.27 11 90 12 93 99 13 3.42 14 2.84 88 83 15 2.54

College Algebra
7th Edition
ISBN:9781305115545
Author:James Stewart, Lothar Redlin, Saleem Watson
Publisher:James Stewart, Lothar Redlin, Saleem Watson
Chapter1: Equations And Graphs
Section: Chapter Questions
Problem 10T: Olympic Pole Vault The graph in Figure 7 indicates that in recent years the winning Olympic men’s...

Related questions
Question
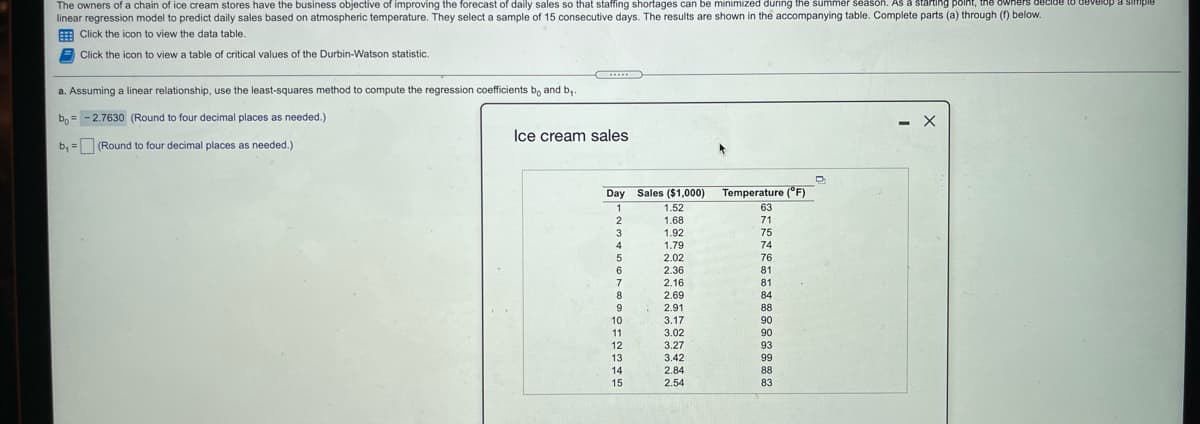
Transcribed Image Text:The owners of a chain of ice cream stores have the business objective of improving the forecast of daily sales so that staffing shortages can be minimized during the summer season. As a starting point, the owners decide to develop a simple
linear regression model to predict daily sales based on atmospheric temperature. They select a sample of 15 consecutive days. The results are shown in the accompanying table. Complete parts (a) through (f) below.
Click the icon to view the data table.
E Click the icon to view a table of critical values of the Durbin-Watson statistic.
a. Assuming a linear relationship, use the least-squares method to compute the regression coefficients b, and b,.
b, = - 2.7630 (Round to four decimal places as needed.)
%3D
Ice cream sales
b, = (Round to four decimal places as needed.)
%3D
Day Sales ($1,000)
Temperature (°F)
63
1
2
1.52
1.68
71
75
3
1.92
1.79
74
76
4
2.02
2.36
6.
81
2.16
2.69
81
8
84
2.91
88
10
3.17
90
11
12
3.02
3.27
90
93
99
13
3.42
2.84
88
83
14
15
2.54
Expert Solution
This question has been solved!
Explore an expertly crafted, step-by-step solution for a thorough understanding of key concepts.

This is a popular solution!

Trending now
This is a popular solution!

Step by step
Solved in 2 steps with 2 images

Recommended textbooks for you
College Algebra
Algebra
ISBN:
9781305115545
Author:
James Stewart, Lothar Redlin, Saleem Watson
Publisher:
Cengage Learning


Linear Algebra: A Modern Introduction
Algebra
ISBN:
9781285463247
Author:
David Poole
Publisher:
Cengage Learning
College Algebra
Algebra
ISBN:
9781305115545
Author:
James Stewart, Lothar Redlin, Saleem Watson
Publisher:
Cengage Learning
Linear Algebra: A Modern Introduction
Algebra
ISBN:
9781285463247
Author:
David Poole
Publisher:
Cengage Learning

Algebra and Trigonometry (MindTap Course List)
Algebra
ISBN:
9781305071742
Author:
James Stewart, Lothar Redlin, Saleem Watson
Publisher:
Cengage Learning

Functions and Change: A Modeling Approach to Coll…
Algebra
ISBN:
9781337111348
Author:
Bruce Crauder, Benny Evans, Alan Noell
Publisher:
Cengage Learning

Glencoe Algebra 1, Student Edition, 9780079039897…
Algebra
ISBN:
9780079039897
Author:
Carter
Publisher:
McGraw Hill