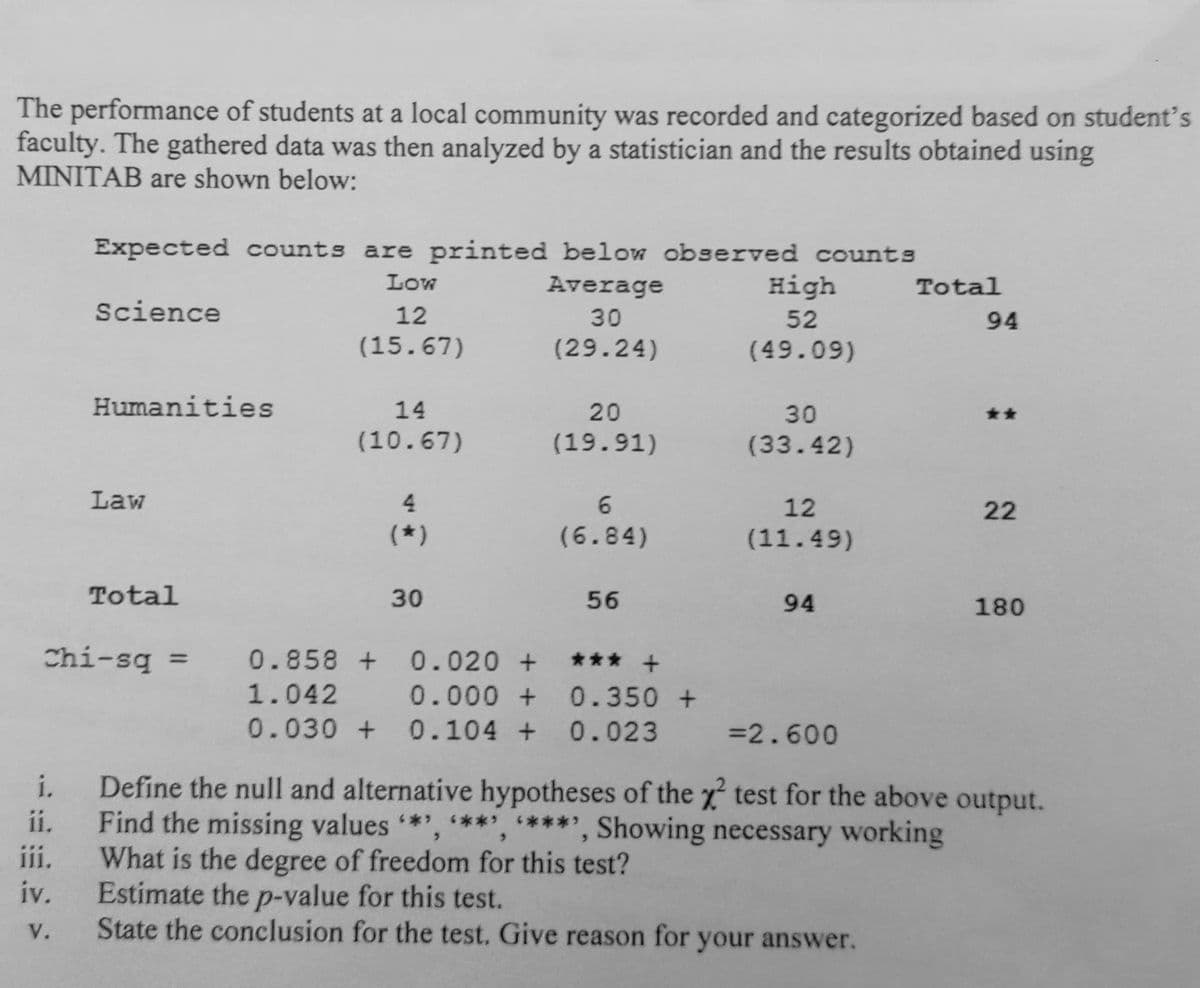
The performance of students at a local community was recorded and categorized based on student's faculty. The gathered data was then analyzed by a statistician and the results obtained using MINITAB are shown below: Expected counts are printed below observed counts Low Average High Total Science 12 30 52 94 (15.67) (29.24) (49.09) Humanities 14 20 30 ** (10.67) (19.91) (33.42) Law 4. 12 22 (*) (6.84) (11.49) Total 30 56 94 180 Chi-sq = 0.858 + 0.020 + *** + 1.042 0.000 + 0.350 + 0.030 + 0.104 + 0.023 =2.600 i. Define the null and alternative hypotheses of the x test for the above output. ii. Find the missing values *', **', ****, Showing necessary working iii. What is the degree of freedom for this test? iv. Estimate the p-value for this test. V. State the conclusion for the test. Give reason for your answer.


Angles in Circles
Angles within a circle are feasible to create with the help of different properties of the circle such as radii, tangents, and chords. The radius is the distance from the center of the circle to the circumference of the circle. A tangent is a line made perpendicular to the radius through its endpoint placed on the circle as well as the line drawn at right angles to a tangent across the point of contact when the circle passes through the center of the circle. The chord is a line segment with its endpoints on the circle. A secant line or secant is the infinite extension of the chord.
Arcs in Circles
A circular arc is the arc of a circle formed by two distinct points. It is a section or segment of the circumference of a circle. A straight line passing through the center connecting the two distinct ends of the arc is termed a semi-circular arc.
please see attach question

Step by step
Solved in 4 steps with 1 images


