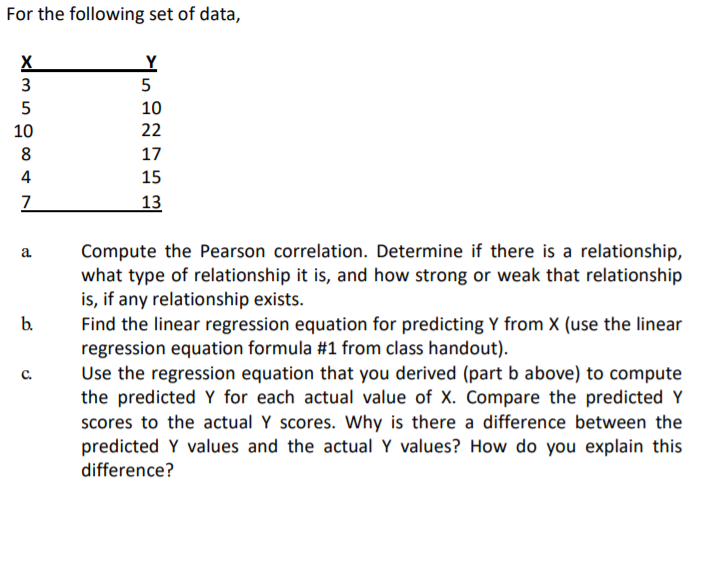
For the following set of data, 3 5 5 10 10 22 8 17 4 15 7 13 Compute the Pearson correlation. Determine if there is a relationship, what type of relationship it is, and how strong or weak that relationship is, if any relationship exists. Find the linear regression equation for predicting Y from X (use the linear regression equation formula #1 from class handout). Use the regression equation that you derived (part b above) to compute the predicted Y for each actual value of X. Compare the predicted Y scores to the actual Y scores. Why is there a difference between the predicted Y values and the actual Y values? How do you explain this difference? a. b.

College Algebra
1st Edition
ISBN:9781938168383
Author:Jay Abramson
Publisher:Jay Abramson
Chapter4: Linear Functions
Section: Chapter Questions
Problem 30PT: For the following exercises, use Table 4 which shows the percent of unemployed persons 25 years or...
icon
Related questions
icon
Concept explainers
Question
For the following set of data,
X
3
5
10
10
22
8
17
15
13
Compute the Pearson correlation. Determine if there is a relationship,
what type of relationship it is, and how strong or weak that relationship
is, if any relationship exists.
Find the linear regression equation for predicting Y from X (use the linear
regression equation formula #1 from class handout).
Use the regression equation that you derived (part b above) to compute
the predicted Y for each actual value of X. Compare the predicted Y
scores to the actual Y scores. Why is there a difference between the
predicted Y values and the actual Y values? How do you explain this
difference?
a.
b.
с.
Transcribed Image Text:For the following set of data, X 3 5 10 10 22 8 17 15 13 Compute the Pearson correlation. Determine if there is a relationship, what type of relationship it is, and how strong or weak that relationship is, if any relationship exists. Find the linear regression equation for predicting Y from X (use the linear regression equation formula #1 from class handout). Use the regression equation that you derived (part b above) to compute the predicted Y for each actual value of X. Compare the predicted Y scores to the actual Y scores. Why is there a difference between the predicted Y values and the actual Y values? How do you explain this difference? a. b. с.
Expert Solution
trending now

Trending now

This is a popular solution!

steps

Step by step

Solved in 4 steps with 3 images

Blurred answer
Knowledge Booster
Correlation, Regression, and Association
Learn more about
Need a deep-dive on the concept behind this application? Look no further. Learn more about this topic, statistics and related others by exploring similar questions and additional content below.
Similar questions
Recommended textbooks for you
College Algebra
College Algebra
Algebra
ISBN:
9781938168383
Author:
Jay Abramson
Publisher:
OpenStax
College Algebra
College Algebra
Algebra
ISBN:
9781305115545
Author:
James Stewart, Lothar Redlin, Saleem Watson
Publisher:
Cengage Learning
Glencoe Algebra 1, Student Edition, 9780079039897…
Algebra
ISBN:
9780079039897
Author:
Carter
Publisher:
McGraw Hill
Algebra and Trigonometry (MindTap Course List)
Algebra
ISBN:
9781305071742
Author:
James Stewart, Lothar Redlin, Saleem Watson
Publisher:
Cengage Learning
Functions and Change: A Modeling Approach to Coll…
Algebra
ISBN:
9781337111348
Author:
Bruce Crauder, Benny Evans, Alan Noell
Publisher:
Cengage Learning