The sccompanying inypothetical production possialtes tables are for New Zesiand and Spain. Each country can produce appies and pluma Now ealand's Production PossiDlities able (Mlians of Bushels) Production Alternatives Product Apples Plus Spain's Production Possibllties Table OM1llons of ushels) Production Alternatives Product Apples 40 a. Plotthe producton posibiltes deta for esch of the two countries separatey. Show the tracing possibilites lines for esch naton if the sctual terms of trace are iplum for 2 spples. Instructions: ( Use the tools provided. PPC NZ and PPC SR (plat 4 paints esch) to draw the PPC curves. (2 Use the tool provided. Tat: in esch diegram (plot 4 points esch) to drew the trading possibiltes lines for esch nation. To earn full credit, you must correctiy plot all points for esch line. New Zealand Spain Tocis 140 Tocls 120 ToT PPC ToT 60 100 60 40 20 10 15 20 25 30 35 40 10 20 30 40 50 60 70 80 Plums (millions of busheis) Plums (milions of bushais) Refering to your grepha. anaver the fallowing Instructions: Enter your anawers as whole numbers . What is ench country's cost ratio of producing plums and apples New Zesiand's cost of producing 1 pluma. sppiea) Spainis coat of producing 1 plumia. applea) e Which nation should specialize in which product? Suppose the optimum product mixes before specializetion and trade were sitemative Bin New Zesiand and siternative S in Spain. d. What would be the gaina from specialzation and trace? Gains spples) and pluma Apples (milons of bushels)
The sccompanying inypothetical production possialtes tables are for New Zesiand and Spain. Each country can produce appies and pluma Now ealand's Production PossiDlities able (Mlians of Bushels) Production Alternatives Product Apples Plus Spain's Production Possibllties Table OM1llons of ushels) Production Alternatives Product Apples 40 a. Plotthe producton posibiltes deta for esch of the two countries separatey. Show the tracing possibilites lines for esch naton if the sctual terms of trace are iplum for 2 spples. Instructions: ( Use the tools provided. PPC NZ and PPC SR (plat 4 paints esch) to draw the PPC curves. (2 Use the tool provided. Tat: in esch diegram (plot 4 points esch) to drew the trading possibiltes lines for esch nation. To earn full credit, you must correctiy plot all points for esch line. New Zealand Spain Tocis 140 Tocls 120 ToT PPC ToT 60 100 60 40 20 10 15 20 25 30 35 40 10 20 30 40 50 60 70 80 Plums (millions of busheis) Plums (milions of bushais) Refering to your grepha. anaver the fallowing Instructions: Enter your anawers as whole numbers . What is ench country's cost ratio of producing plums and apples New Zesiand's cost of producing 1 pluma. sppiea) Spainis coat of producing 1 plumia. applea) e Which nation should specialize in which product? Suppose the optimum product mixes before specializetion and trade were sitemative Bin New Zesiand and siternative S in Spain. d. What would be the gaina from specialzation and trace? Gains spples) and pluma Apples (milons of bushels)

Chapter1: The Role And Method Of Economics
Section: Chapter Questions
Problem 9P

Related questions
Question
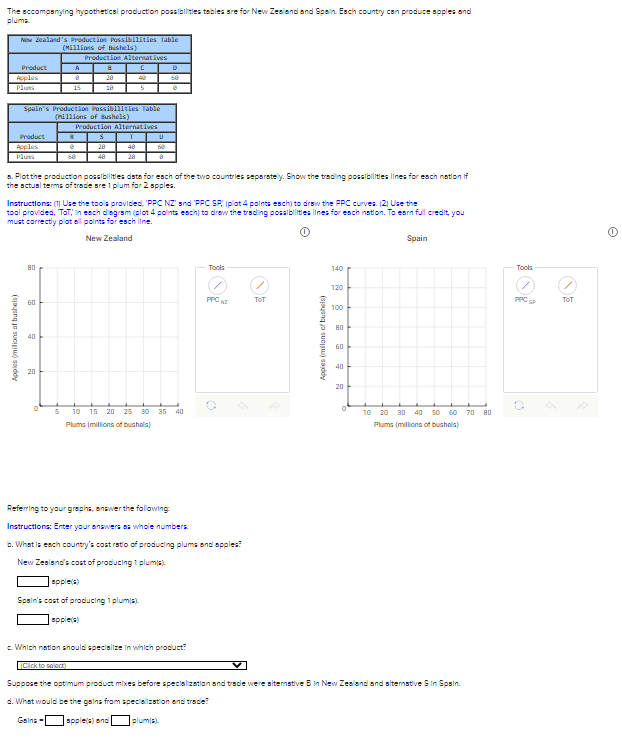
Transcribed Image Text:The sccompanying hypothetical production possibilities tables are for New Zesiand and Spain. Esch country can produce spples and
plums
New Zealand's Production Possibllities Table
(Millions of Bushels)
Production Alternatives
Product
Apples
28
60
Plus
15
18
Spain's Production PossIblilties Table
(Millions of Bushels)
Production Alternatives
Product
Apples
Plums
20
48
20
a. Plotthe production possibilities dsta for esch of the two countries separatejy. Show the tracling possibilities lines for each nation if
the sctusl terms of trade sre 1 plum for 2 spples.
Instructions: (I Use the tools provided, 'PPC NZ' snd 'PPC SP iplat 4 polnts esch) to drsw the PPC curves. (2) Use the
tool provided, ToT, in esch diegram (elot 4 points esch) to draw the trading possibilities lines for esch nation. To earn full credit, you
must correctly plot al points for esch Iine.
New Zealand
Spain
Tools
140
Tools
120
TOT
PPC s
TOT
100
80
40
40
20
20
5
10
15 20
25 30
35 40
10 20 30 40
50 60
70
80
Plums (millions of bushels)
Plums (millions of bushels)
Referring to your grepha, answer the following
Instructions: Enter your anawers as whole numbers.
b. What is esch country's cost rstio of producing plums and apples?
New Zesland's cost of producing 1 plums).
spples)
Spain's cost of producing 1 plums).
spples)
c Which nation should specialtze in which product?
(Cick to select)
Suppose the optimum product mixes before specialization and trade were sitemstive B in New Zesland and siternstive S in Spsin.
d. What would be the gains from specialzstion and trade?
Galns-
spplejs) and
plums).
Apples (milions of bushels)
Apples (milons of bushels)
Expert Solution
This question has been solved!
Explore an expertly crafted, step-by-step solution for a thorough understanding of key concepts.

Step by step
Solved in 2 steps with 2 images

Knowledge Booster


Learn more about
Need a deep-dive on the concept behind this application? Look no further. Learn more about this topic, economics and related others by exploring similar questions and additional content below.Recommended textbooks for you
Exploring Economics
Economics
ISBN:
9781544336329
Author:
Robert L. Sexton
Publisher:
SAGE Publications, Inc


Principles of Economics 2e
Economics
ISBN:
9781947172364
Author:
Steven A. Greenlaw; David Shapiro
Publisher:
OpenStax
Exploring Economics
Economics
ISBN:
9781544336329
Author:
Robert L. Sexton
Publisher:
SAGE Publications, Inc
Principles of Economics 2e
Economics
ISBN:
9781947172364
Author:
Steven A. Greenlaw; David Shapiro
Publisher:
OpenStax