The shear resistance of soil, y kPa, is determined by measurements as a function of the normal stress, x kPa. The data are as shown below. Find the regression model, and the coefficient of correlation y 10 14.08 11 15.57 12 16.94 13 17.68 14| 18.49 15 19.55 16 20.68 17 21.72 18 22.80 19 23.84 20 24.79 21 25.67
The shear resistance of soil, y kPa, is determined by measurements as a function of the normal stress, x kPa. The data are as shown below. Find the regression model, and the coefficient of correlation y 10 14.08 11 15.57 12 16.94 13 17.68 14| 18.49 15 19.55 16 20.68 17 21.72 18 22.80 19 23.84 20 24.79 21 25.67

Functions and Change: A Modeling Approach to College Algebra (MindTap Course List)
6th Edition
ISBN:9781337111348
Author:Bruce Crauder, Benny Evans, Alan Noell
Publisher:Bruce Crauder, Benny Evans, Alan Noell
Chapter5: A Survey Of Other Common Functions
Section5.6: Higher-degree Polynomials And Rational Functions
Problem 1TU: The following fictitious table shows kryptonite price, in dollar per gram, t years after 2006. t=...

Related questions
Question
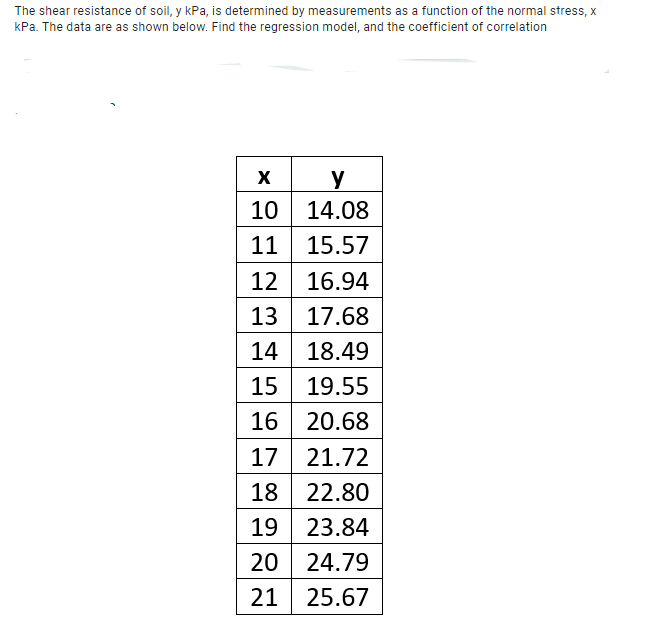
Transcribed Image Text:The shear resistance of soil, y kPa, is determined by measurements as a function of the normal stress, x
kPa. The data are as shown below. Find the regression model, and the coefficient of correlation
y
10 14.08
X
11 15.57
12 16.94
13 17.68
14 18.49
15 19.55
16 20.68
17 21.72
18 22.80
19 23.84
20 24.79
21 25.67
Expert Solution
This question has been solved!
Explore an expertly crafted, step-by-step solution for a thorough understanding of key concepts.

This is a popular solution!

Trending now
This is a popular solution!

Step by step
Solved in 3 steps

Recommended textbooks for you
Functions and Change: A Modeling Approach to Coll…
Algebra
ISBN:
9781337111348
Author:
Bruce Crauder, Benny Evans, Alan Noell
Publisher:
Cengage Learning

Glencoe Algebra 1, Student Edition, 9780079039897…
Algebra
ISBN:
9780079039897
Author:
Carter
Publisher:
McGraw Hill

College Algebra
Algebra
ISBN:
9781305115545
Author:
James Stewart, Lothar Redlin, Saleem Watson
Publisher:
Cengage Learning
Functions and Change: A Modeling Approach to Coll…
Algebra
ISBN:
9781337111348
Author:
Bruce Crauder, Benny Evans, Alan Noell
Publisher:
Cengage Learning
Glencoe Algebra 1, Student Edition, 9780079039897…
Algebra
ISBN:
9780079039897
Author:
Carter
Publisher:
McGraw Hill
College Algebra
Algebra
ISBN:
9781305115545
Author:
James Stewart, Lothar Redlin, Saleem Watson
Publisher:
Cengage Learning