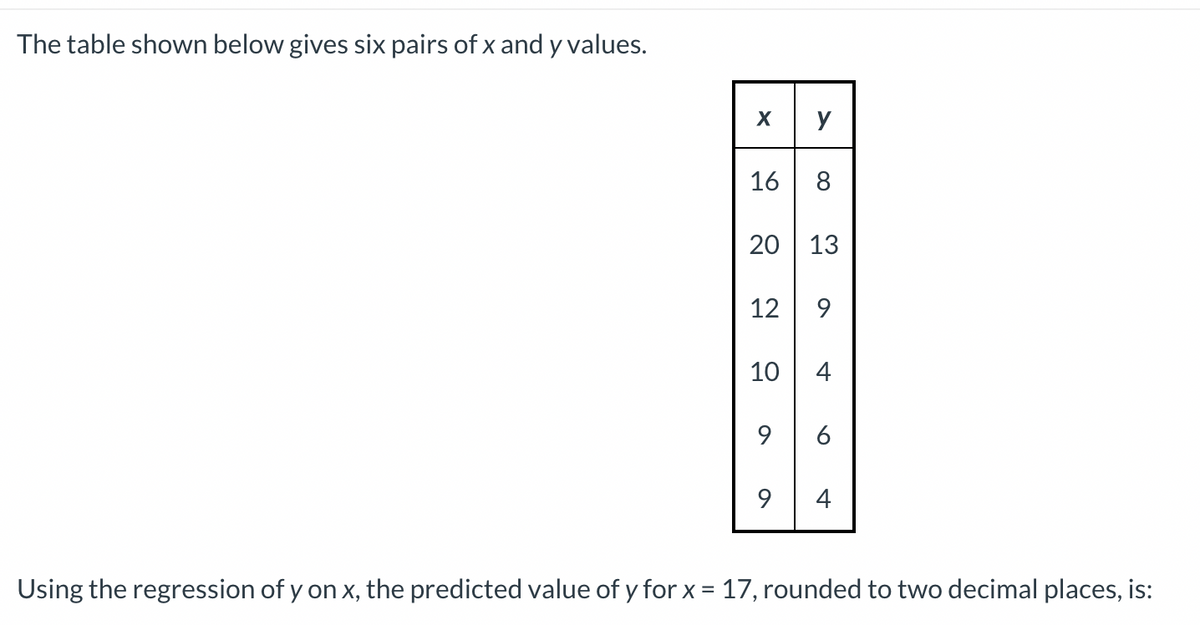
The table shown below gives six pairs of x and y values. y 16 8 20 13 12 10 4 6 9. 4 Using the regression of y on x, the predicted value of y for x = 17, rounded to two decimal places, is:


Q: Consider the following data for two variables, x and y. 32 18 15 9 26 y 10 20 22 17 22 (a) Develop…
A: The following data for two variables x and y are given: a) Regression statistics,…
Q: For the following ANOVA table for a simple linear regression of Y on X. Sov Regression 1 Error Total…
A: ANOVA table for a simple linear regression of Y on X is given: We are asked to find the value of B:…
Q: Use the given data to find the equation of the regression line. Examine the scatterplot and identify…
A: Regression line is given by,
Q: Consider the data. x; 2 3 4 5. Y; 2 8. 11 12 The estimated regression equation for these data is ý =…
A:
Q: (b) To assess balance, you run a series of bivariate regression models with all X variables as…
A: The p-value for the difference in all independent variable between treatment and control groups is…
Q: Use the given data to find the equation of the regression line. Examine the scatterplot and identify…
A:
Q: Twenty beluga whales were randomly chosen from the MacKenzie Delta. For each whale, liver selenium…
A: Regression line are used to predict the future value over the another. It is calculated to predict…
Q: 27. Consider the data in the following table regarding revenue generated in a company during a…
A: Given, Year, X Revenue, Y 1 5 2 7 3 8
Q: Which of the following population assumptions for bivariate regression is INCORRECT? A. Population…
A: Given model yi=βo+ β1*xi+ ui
Q: Suppose a researcher collects data on houses that have sold in a particular neighborhood over the…
A: The dependent variable is ln(Price). The size of the house in consideration is 2000 square feet and…
Q: Personal wealth tends to increase with age as older individuals have had more opportunities to earn…
A: (d). Determine there is a significant relationship between wealth and age at the 10% level of…
Q: Use the given data to find the equation of the regression line. Examine the scatterplot and identify…
A: Given First enter this data into Excel
Q: x y 1 10 4 5 5 3.5 7 2 10 1.5 Which description best fits the
A: We have given that data I want to find regression model Y = n + mx Where m = slope , n=…
Q: Calculate the regression equation of X on Y from the data given below, taking deviations from actual…
A:
Q: The following table shows the average annual income in a certain country, adjusted for inflation,…
A: Given :- The Table shows the annual income in a certain country , adjusted for inflation.
Q: Use the given data to find the equation of the regression line. Examine the scatterplot and identify…
A:
Q: Personal wealth tends to increase with age as older individuals have had more opportunities to earn…
A: Note: Hey, since multiple sub parts are posted, we will answer first three sub parts according to…
Q: Consider the following data for two variables, x and y. 32 18 15 9 26 y 10 21 | 22 17| 23 (a)…
A: a) Excel Procedure: Enter X and Y data in Excel Go to Data Click on Data Analysis……..>…
Q: Use the given data to find the equation of the regression line. Examine the scatterplot and identify…
A: The values of x and y are given to find the regression line.
Q: The following table shows unit sales of iPhones for the given year. t= years since 2010 0 1 2 3 |! =…
A: Hello! As you have posted more than 3 sub parts, we are answering the first 3 sub-parts. In case…
Q: Consider the following data for two variables, x and y. x 9 32 18 15 26 y 11| 21| 22 17 23 (a)…
A: In the given data, y is the response variable (dependent variable) and x is the explanatory variable…
Q: The following table lists the monthly incomes (in hundreds of dollars) and the monthly rents paid…
A: Given that X Y X \cdot YX⋅Y X^2X2 Y^2Y2 24 7.0 168 576 49 16 4.5 72 256 20.25 19…
Q: Consider the following data for two variables, x and y. 9 32 18 15 26 y 10 21 22 17 23 (a) Develop…
A: Given data, y x x2 10 9 81 21 32 1024 22 18 324 17 15 225…
Q: Consider the data. 3 12 6 20 14 55 35 60 10 25 The estimated regression equation for these data is ŷ…
A: Given Xi 3 12 6 20 14 Yi 55 35 60 10 25
Q: Consider the following model of stock prices: Price=Bo + Biearning + ɛ. Where earning is the annual…
A: The sample size is the number of paired data values, that is n=10. Using the given data set and…
Q: Assume that the MLR 1-6 hold and the true effect of x is zero. What is the probability that the…
A:
Q: Consider the data in the table below. X 1 5 4 8 3 2 1 7 2)| The slope coefficient for a regression…
A: As per our guidelines we can solve first three sub part of question and rest can be reposted.…
Q: b. The compressive strength of a concrete and the curing time are believed to related. An…
A: Let X be the compressive strength and Y be the curing time as a dependent variable. The linear…
Q: Consider the following model of stock prices: Price=Bo + Biearning + ɛ. Where earning is the annual…
A: d. Using Excel, calculate SSE: SSE=∑ (Y-(β0+β1*X))2 95% Confidence interval for slope parameter:…
Q: Consider the linear regression model Y; = Bo + Bị X; + U; and assume that E(U;|X;) = 4 for each i =…
A: # Given regression model hi=b0+b1*xi+ui & also E(ui/xi)=4 then to defined b0??
Q: Use the given data to find the equation of the regression line. Examine the scatterplot and identify…
A: From the given data we want to find the regression line.
Q: Use the given data to find the equation of the regression line. Examine the scatterplot and identify…
A: Given: The data given is as follows x y 11 11.06 7 8.26 5 4.74 8 9.5 10 10.9 9 10.38…
Q: We want to estimate the effect of x on y using a simple linear regression. Assume that the MLR 1-6…
A: Given Information: The effect of x on y is to be estimate using a simple linear regression. The…
Q: The data below are years(x) and the profit (y) in millions of dollars for Company X. (n 6) X y 0 15…
A: Since you have posted a question with multiple sub-parts, we will solve first three sub- parts for…
Q: Use the given data to find the equation of the regression line. Examine the scatterplot and identify…
A:
Q: The data shown below for the dependent variable, y, and the independent variable, x, have been…
A: Hi! Thank you for the question, As per the honor code, we are allowed to answer three sub-parts at a…
Q: Use the given data to find the equation of the regression line. Examine the scatterplot and identify…
A: Given datax y13 17.1411 16.865 7.547 12.0612 17.188 13.80…
Q: Use the given data to find the equation of the regression line. Examine the scatterplot and identify…
A: Given data, X Y X*Y X*X 13 11.54 150.02 169 11 12.06 132.66 121 7 8.86 62.02 49 10…
Q: Use quartic regression to model the following data set. (Round your regression parameters to two…
A: ACCORDING to the problem, we have
Q: Use quartic regression to model the following data set. (Round your regression parameters to two…
A: We have to find the quadrtic regression to model the given data set.
Q: Use the given data to find the equation of the regression line. Examine the scatterplot and identify…
A:
Q: X Y 1 2.5 4.4 1 2 13.6 4 20.7 4 25.6 36.2 5 Using the formulas for linear regression, find the…
A: From the given information,
Q: The table shown below gives seven pairs of x and y values. y 12 18 35 14 12 8 40 10 25 7 33 18 10…
A: We have given that Regression equation. Y^ = a + bX Where a = intercept and b= slope
Q: The following table lists the ages (in years) and the prices (in thousands of dollars) for a sample…
A:
Q: The following data show, in convenient units, the yield Y of a chemical reaction run at various…
A:
Q: The following table lists the monthly incomes (in hundreds of dollars) and the monthly rents paid…
A: X: 24,16,19,31,11,27 Y: 7,4.5,6.5,11.5,4.5,8.5
Q: Q2: For the raw data shown in Table below: 1) Find out which of the x₁ or x₂ variables is better…
A: Given: The raw data is given. Find: Find out which x1 or x2 is better correlated to y.Find the…
Q: 14. Find out the ‘b’ value of regression from the following data. X Y 10 12 12 13 10 11 8…
A:
Q: Q.1/ Use linear regression to fit the following experimental data. 0 2 3 4 5 7 10 y 0 5.2 7.8 10.7…
A: We need to use the linear regression to fit the following data. X Y 0 0 2 5.2 3 7.8 4…
Q: 2 3. 4 5 3 7 11 14 a. Develop the estimated regression equation for these data (to 1 decimal). b.…
A:


Trending now
This is a popular solution!

Step by step
Solved in 3 steps with 3 images

- The prelim grades (x) and midterm grades (y) of a sample of 10 MMW students is modeled by the regression line y = 12.0623 + 0.7771x. Estimate the prelim grade if the midterm grade is 83.Which of the following best describes a regression coefficient in a bivariate setting? a. The change in Y predicted by a unit change in X b. The slope of a line that minimizes the sum of squared residuals c. The correlation coefficient multiplied by SDy/SDx d. All of the aboveAn article reported that for a regression of y = average SAT score on x = expenditure per pupil, based on data from n = 44 New Jersey school districts, a = 766, b = 0.015, r2 = 0.160, and se = 53.7. One observation in the sample was (9400, 897). What average SAT score would you predict for this district, and what is the corresponding residual?Predict average SAT score _______ Residual ________
- A linear regression model has been estimated for the variables Y="monthly consumption of veal (kg)", X1="monthly monetary household income (thousand EUR)" and X2="household size (number of members)" using data for a random sample of 80 households. The following results have been obtained: b0=0.3 b1=0.5 b2=0.7 R-sq=0.9 R=0.95,Interpret the value of regression coefficient b2.A sample consists of 500 houses sold in Karachi between January 2020 and December 2020. The multiple linear regression analysis is carried out to predict the house prices for investment in residential properties in Karachi, Pakistan. The output below is produced using SPSS. Model Unstandardized Coefficients t VIF Constant 14.208 5.736 Age of house -0.299 -2.322 1.58 Square footage of the house 0.364 2.931 1.71 Income of families in the area 0.004 0.392 1.01 Transportation time to major markets -0.337 -2.619 1.90, R2 = 0.67; DW = 2.08 How would you interpret the above ‘Output’ of a regression analysis performed in SPSS?We want to estimate the effect of x on y using a simple linear regression. Assume that the MLR 1-6 hold and the true effect of x is zero. What is the probability that the t-statistic of the slope coefficient in the above regression is positive? a. 5% b. +/- 1.96 c. 95% d. 50%
- A. Identify the regression analyses necessary for testing this initial model. B. What are the direct and indirect effects of z2 on z5?Suppose we run a regression of Y on X using the following data points( xy)in a sample: (0, 1,(1,2).(-10, 9). What is the OLS regression line and what is the RSS? A:1+2X, RSS=3 B:1+X, RSS=0 C:2+X, RSS=-1 D:2+X, RSS=0A researcher conducted a number of descriptive statistics for two variables X and Y. They were as follows: SP = -20; SSx = 4; My = 7; Mx = 3 What is b equal to? What is a equal to? Using b and a construct a regression equation, and then using the regression equation, calculate the value of predicted Y when X = 2?
- Using data on class size(CS) and average test scores(TS) from 150 middle school classes, estimates the OLS regression, TS_hat = 750 -5.5(CS), R^2=0.7 . The sample average class size for the 150 classes is 20. What is the sampel average test score for the 150 classes?A group of students measure the length and width of a random sample of beans. They are interested in investigating the relationship between the length and width. Their summary statistics are displayed in the table below. All units, if applicable, are millimeters. Mean width: 7.586 Stdev width: 0.877 Mean height: 13.037 Stdev height: 1.697 Correlation coefficient: 0.7814 d) If the students are interested in using the height of the beans to predict the width, calculate the slope of this new regression equation. e) Write the equation of the best-fit line that can be used to predict bean widths. Use x to represent height and y to represent width.X Y 5 10 3 6 6 7 4 3 2 4 a. Compute the Pearson correlation. b. Find the regression equation for predicting Y from X. c. Calculate SSresidual