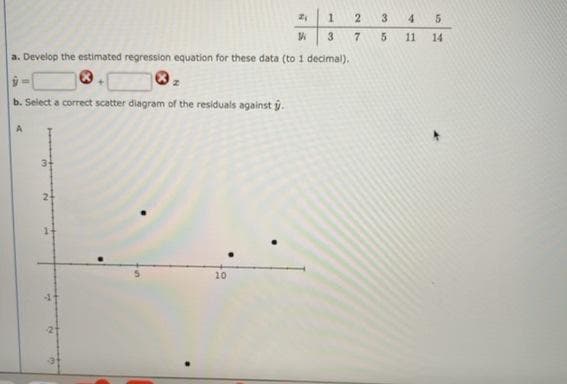
2 3. 4 5 3 7 11 14 a. Develop the estimated regression equation for these data (to 1 decimal). b. Select a correct scatter diagram of the residuals against y.


Q: Consider the following data for two variables, x and y. 9 32 18 15 26 y 11 21 22 17 23 (a) Develop…
A: Let y^ denotes the predicted value of the dependent variable y. The values of x2 is determined using…
Q: Which of the following best describes a regression coefficient in a bivariate setting? a. The…
A: Correct answer is d. All of the above
Q: 233 4SS G6 10 11 12 15 19 20 18 Pind the regression ne for the data. Assumeis the dificuty level and…
A: We have given that, X:- 2, 3, 3, 4, 5, 6, 6, 6 Y:- 10, 11, 12, 9, 15, 19, 20, 18 Then, We will find…
Q: 5. Find regression line to the following data. 4 5 3.2 5.6 9.3 14. 21.9 Y 24 21 2.1 Also find the…
A:
Q: The U.S. Postal Service is attempting to reduce the number of complaints made by the public against…
A: Given: r = 0.854 r squared = 0.730 Model Unstandardized Coefficients Standardized Coefficients t…
Q: Suppose a researcher collects data on houses that have sold in a particular neighborhood over the…
A: The dependent variable is ln(Price). The size of the house in consideration is 2000 square feet and…
Q: 14. Consider the following regression equation: Y = 30 - 9X. If SSE = 600 and SS Total = 1,200, then…
A: The square of correlation coefficient is computed by r2=1-SSESST, where SSE is the error sum of…
Q: Are there any points with unusually large residuals? (Select all that apply.) A) (x, y) = (4,…
A: Answer:- Option H is the correct answer.
Q: The U.S. Postal Service is attempting to reduce the number of complaints made by the public against…
A:
Q: & Obtain the regression equations from the data given below: 1 2 9 8 3 4. 6. 8 10 12 11 13 14 16 15…
A: Solution is given:
Q: Given the following data: 3 4. 8 2. 10 15 8 9. 6. 11 15 Obtain the two regression equations and…
A: Given data is x 5 3 7 4 8 2 10 6 8 7 9 15 y 8 6 8 5 9 6 8 5 11 7 8 15
Q: 1. Formulate the regression equation for the data. 2. What would be the likely blood pressure…
A: The question is about regression Given :
Q: 1. The table shows the rate of injury among young workers compared to the actual number of injury…
A: Given: X Y 1165711612110069980110401059586308962946010280…
Q: The accompanying data resulted from an experiment in which weld diameter and shear strength (in…
A: Here, the line of regression is given as: Strength = -941.6992 + 8.5988*Diameter Let, Strength be…
Q: 2) Given are five observations collected in a regression study on two variables. 3 5 4 7 30 30 25 28…
A: For the given data ( a Develop scatter plot ( b ) Find regression equation ( c ) Predict y when x =6
Q: The U.S. Postal Service is attempting to reduce the number of complaints made by the public against…
A: Given Information: The U.S. Postal Service is attempting to reduce the number of complaints made by…
Q: A group of students measure the length and width of a random sample of beans. They are interested in…
A: d) Compute the estimated slope of the regression line using the formula: b=rsysx Where, 'b' is the…
Q: 1a. Develop an estimated regression equation for these data. 1b. Compute the residuals and…
A: The regression output obtained in excel is as follows Coefficients Standard Error t Stat…
Q: Consider the following data for two variables, x and y. 32 18 15 26 y 11 | 19 20| 17 | 21 (a)…
A: Given: x y 9 9 32 19 18 22 15 17 26 23
Q: Which of the following is not an assumption for simple linear regression? Select one: a. Normally…
A: In simple linear regression y = a + bx, y is response variable ane only one explanatory variable x.
Q: 9. A regression between foot length (response variable in cm) and height (explanatory variable in…
A: Let define the variables: x = height of the students y =Foot length of the students The given…
Q: For the following set of data, X 3 Y 5 5 10 10 22 8 17 4 15 7. 13 Compute the Pearson correlation.…
A:
Q: A runner was tested on a treadmill. During the test, his speed x (in km/h) and his heart rate y were…
A: Given data: y 122 132 143 160 174 189 x 9 11 13 15 17 19
Q: 1. Consider the following data for two variables, x and y.x 22 24 26 30 35 40y 12 21 33 35 40 36a.…
A: Hello. Since your question has multiple sub-parts, we will solve first three sub-parts for you. If…
Q: 1. From the following data and given output, determine the equation of the regression line and…
A: The correlation coefficient between the two variables can be calculated by using the cell function…
Q: Respond to the following prompts in your initial post: 1. Identify the explanatory variables and…
A: Since there are multiple sub-parts, as per the honor code the first three sub-parts will be solved.…
Q: Qs- For the following data: 1 2 3 4 5 6 7 y, 9 13 14 17 18 19 19 20 a- Find the least square…
A: Step-by-step procedure to find the regression equation using Excel: In Excel sheet, enter x in one…
Q: 15.23. You are given the following observations on X and Y 1 3 8 Y 1 3 2 5 4 Using linear regression…
A:
Q: 1. Consider the following data table of x- and y-values, where x is predictor variable and y is the…
A: The values of x and y are given. Part 1a) The linear regression equation is as follows: Calculate…
Q: The commercial division of a real estate firm is conducting a regression analysis of the…
A: Given data The regression equation is Y=20.2+7.25X Predictor Coef SE Coef…
Q: The commercial division of a real estate firm is conducting a regression analysis of the…
A: From the given information, The regression line is given as: Y=20.2+7.25X.
Q: Write the regression equation that represents the above equation. Y = 9.804326378 + 0.65795*X1 +…
A: The F test is used to test whether the regression model is effective or not. In this test the null…
Q: The data is given as follow. xi 2 6 9 13 20 Vi 7 18 9 26 23 The estimated regression equation for…
A: The given regression equation is y-hat = 7.6 + 0.9 x.Required calculations for finding SSE, SST and…
Q: Consider the output shown in Table 4.1. What is the value of the regression df? 1 3
A: From the given information, the residual degrees of freedom is 16 and the total degrees of freedom…
Q: 1) Given are five observations collected in a regression study on two variables. 2 4 5 7 8 2 3 6 4…
A: Given data x 2 4 5 7 8 y 2 3 2 6 4
Q: 15.3 #6 The authors of the article "Age, Spacing and Growth Rate of Tamarix as an Indication of…
A: (a) Correct answer is (C), (D), (E), (G)
Q: The following sample observations were randomly selected X Y 4 4 5 6 3 5 6 7 10 7 What is the…
A: The regression equation Y on X is, Y=a+bXwherea=intercept of regression lineb=slope of regression…
Q: 002 49 Q1. [6 points] :From the following data set 1 4. 6. 11 16 1.find correlation coefficients 2.…
A: Given table : X Y 1 4 2 8 3 9 6 11 5 16
Q: A statistical program is recommended. Consider the following data for two variables, x and y. x 22…
A: To obtain linear regression R-software is used.
Q: Which of the following would affect the reliability of a forecast made using linear regression? (i)…
A: One of the basic assumptions in linear regression is the assumption of linear relationship between…
Q: The commercial division of a real estate firm is conducting a regression analysis of the…
A:
Q: 8. For the following data: a. Find the regression equation for predicting Y from X. b. Calculate the…
A:
Q: A regression between foot length (response variable in cm) and height (explanatory variable in…
A: Given that A regression between foot length (response variable in cm) and height (explanatory…
Q: 14. Given the following data : 6. 2 10 Y 9. 11 8. Find the two regression equations and calculate…
A:
Q: 5. For the following set of data: Y 1 10 5 4 4 13 a. Find the regression equation for predicting Y…
A: An F-test for equality of variances is a hypothesis test that is used to assess whether two…
Q: 12. Use the given data to find the equation of the regression line. Round the final values to three…
A: We consider dexterity to be the dependent variable and productivity to be the independent variable.
Q: 6, Given are five observations collected in a regression study on two variables. 2. 13 20 19 8. 27…
A: Given observation and Calculation x y x2 y2 xy 2 7 4 49 14 6 19 36 361 114 9 8 81 64 72…
Q: For the following data: Y 1 5 2 10 9. 3 12 11 4 13 Find the regression equation for predicting Y…
A:
Q: Consider the following data for two variables, x and y. x 9 32 | 18 15 26 y 9 20 21 17 23 (a)…
A: a) Excel Procedure: Enter X and Y data in Excel Go to Data Click on Data Analysis> ‘Regression’.…
Ñ6


Trending now
This is a popular solution!

Step by step
Solved in 3 steps with 3 images

- Olympic Pole Vault The graph in Figure 7 indicates that in recent years the winning Olympic men’s pole vault height has fallen below the value predicted by the regression line in Example 2. This might have occurred because when the pole vault was a new event there was much room for improvement in vaulters’ performances, whereas now even the best training can produce only incremental advances. Let’s see whether concentrating on more recent results gives a better predictor of future records. (a) Use the data in Table 2 (page 176) to complete the table of winning pole vault heights shown in the margin. (Note that we are using x=0 to correspond to the year 1972, where this restricted data set begins.) (b) Find the regression line for the data in part ‚(a). (c) Plot the data and the regression line on the same axes. Does the regression line seem to provide a good model for the data? (d) What does the regression line predict as the winning pole vault height for the 2012 Olympics? Compare this predicted value to the actual 2012 winning height of 5.97 m, as described on page 177. Has this new regression line provided a better prediction than the line in Example 2?A set of n = 15 pairs of X and Y values has a correlation of r = +0.80 with SSY = 75, and the regression equation for predicting Y is computed. Find the standard error of estimate for the regression equation. How big would the standard error be if the sample size were n = 30.Assume that variables xx and yy have a significant correlation, and that the line of best fit has been calculated as ˆy=1.4x+3.6y^=1.4x+3.6. One observation is (9,16.3)(9,16.3).What is the predicted value of yy for the value x=9x=9? What is the residual for the value x=9x=9? What is the best interpretation for the residual? The value 16.316.3 is below the average value for yy when x=9x=9 The value 99 is above the average value for yy when y=16.3y=16.3 The value 16.316.3 is above the average value for yy when x=9x=9. The value 16.316.3 is below the average value for xx when y=16.3
- 1)Write the regression equation that represents the above equation. Y = 9.804326378 + 0.65795*X1 + 0.200358 X2 Height of an individual = 9.8043 + 0.6579*Mother's Height + 0.2004* Father's Height 2)Is this a good predictor equation? Why or why not (use appropriate statistics/hypothesis test to prove your point)?(1) Write out the regression equation (2) What is the sample size used in this investigation? (3) Determine the values of *, ** and ***, ****If other factors are held constant and the Pearson correlation value between X and Y is r = 0.80, then the regression equation will tend to produce more accurate predictions than would be obtained if the Pearson correlation value was r = 0.60. Group of answer choices True False
- If a sample of 25 pairs of data yields a correlation coefficient, r, of 0.390 and the scatterplot displays a linear trend, can you use the regression equation to make predictions, assuming your x-values are within the domain of the data set? Choose your answer from the multiple choice answers below A.) Yes, because rcrit = 0.396 and the regression coefficient, r, is less than this value. B.) Yes, because rcrit = 0.381 and the regression coefficient, r, is greater than this value. C.) No, because rcrit = 0.381 and the regression coefficient, r, is greater than this value. D.) No, because rcrit = 0.396 and the regression coefficient, r, is less than this value.Consider the following regression equation specied for 2-period panel data: where i = 1; 2; :::N and t = 1; 2. If you expect that β_1 is positive, but the correlation between Δx_i and Δu_i is negative, thenwhat is the bias in the OLS estimator of β_1 in the first-differenced equation?7. In a simple regression, if MSR=6400 and MSE=100, then the t statistic that we use to test the significance of the estimated slope is _____. Select one: 8 2 14 6
- The birth lengths in cm (x) and birth weights in kg (y) of a sample of 50 newborn female babies are compared, yielding a correlation coefficient of r=0.578 and a linear regression equation of ŷ =−8.89+0.243x The babies all had lengths between 46.5 and 53.0 cm, and weights between 2.50 and 4.05 kg. Based on this, predict the birth weight of a newborn female baby with a birth length of 48.5 cm.Jimmy tested a sample with of n=4 pairs of X and Y scores and found SSY = 48 and a Pearson correlation between X and Y of r = 0.4 Calculate whether the Fobserved in this regression experiment is significant at the ∞ = o.01 levelIn a study of possible correlation between the height in cm (X) and the weight in kg (Y) of chimpanzees, a sample of 40 animals produces a correlation coefficient of r=0.813 and a regression line with equation Y=0.34X+19.5. What is the expected weight of a chimpanzee that is 157 cm tall? Round off final answer to 2 decimal places.
