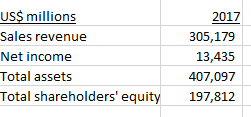
US$ millions Sales revenue 2017 305,179 Net income 13,435 Total assets Total shareholders' equity 407,097 197,812


Q: 2013 2014 2015 Total debt 1,750 1,900 2,000 Total equity 5,000 4,500 4,000 What conclu sio ns can…
A: Calculate Debt-Equity Ratio as below: Debt-Equity…
Q: -/ 10 Sales revenue $794,580 $696,600 Cost of goods sold 468,000 410,000 Operating expenses…
A: The Balance Sheet and Income Statement of two years of a Company are given.
Q: How much is the consolidated profit in 2021? A. 301,000 B. 336,000 C. 310,000 D. 320,000
A: When one company acquires or buys shares of the other company the parent company has to record all…
Q: For the year ended December 31, 2021 Sales P 6,100,0 Cost of sales 3,700,00 Gross profit Gain on…
A: The cash flow statement is prepared to estimate the net cash inflow or outflow from the business…
Q: Fusion Energy Co’s earnings before interest and taxes (EBIT) was $275 million. Assuming Fusion…
A: NOPAT is calculated as EBIT less taxes
Q: This problem is based on the 2017 annual report of Campbell Soup Company. Answer the following…
A: Consolidated financial statements: These financial statements are consolidated financial statements…
Q: Return on Assets The following financial data is from Hi-Tech Instruments' financial statements…
A:
Q: Balance sheet? Sales 46,828 Purchases 32,222 Capital 80,000
A: Balance sheet: The balance sheet shows the financial position of the company by recording all the…
Q: Income Statement (2017) 1.500 Balance Sheet (2017) Accounts Payable ? Short-Term Debt ? Long-Term…
A: Income Statement Credit Sales 1500 Cost Of Goods Sold (80%0f Sales) 1200 Taxable Income 300…
Q: From the books of Krabby Co. for 2017: Sales…
A: Comprehensive income is the complete picture of all incomes and expenses.
Q: Return on Sales The following financial data is from Hi-Tech Instruments' financial statements…
A:
Q: 2017 2016 Sales revenue S3.940 $3,600 Costs and expenses Cost of goods sold 1,055 990 Selling &…
A: Answer) Calculation of Net Profit Margin for 2016 Net Profit Margin for 2016 = Net Income for 2016/…
Q: Accounts receivable Inventory Net sales (all credit) Cost of goods sold Total assets Total…
A: Formula: Receivables turnover ratio = ( Net credit sales / Average Accounts receivables )
Q: Current Assets : Cash and Equivalents Accounts Receivable 100,000,000 Inventory Fixed (Long-term)…
A: Financial Ratios are the performance ratios which provide a fair idea of the performance of the…
Q: Return on Sales The following financial data is from Hi-Tech Instruments' financial statements…
A: Given: Current Price per share = $62.25 EPS(Earnings per share) = $4.15 Dividend = $2,600,000 Number…
Q: Income Statement (2016) Credit Sales Cost of Goods Sold (800) Taxable Income Taxes (34%) Balance…
A: Income Statement (2016) Particulars Amount Credit Sales 1000 Cost of Goods Sold (800)…
Q: 2019: Profit Margin – Profit $1435 / Net Sales $38,464 = 0.037:1 OR 3.7% Working Capital – Current…
A:
Q: $75,000,000 $80,000,000 2017 Total assets 2018 Total assets $ 1,875,000 $ 1,925,000 $ 4,525,000 $…
A: ROI stands for Return on investment that shows the percentage of return received from the invested…
Q: Comprehensive Income December 31, 2017 and 2018 2017 4,551,000 Increase/Decrease Peso Percent 2018…
A: Horizonal Analysis Horizontal analysis is one of the method to use to measure the financial strength…
Q: (Comprehensive Income) Roxanne Carter Corporation reported the following for 2017: net sales…
A: a.
Q: 2018 Income Balance Statement Sheets $ 455,000 (221,500) (58,600) (24,000) 23,500 174,400 Sales Cost…
A: Cash flow statement is prepared to know how adjustment in income and balance sheet effects the cash…
Q: The Crane Company has disclosed the following financial information in its annual reports for the…
A: Cash flow from operating activities is the cash inflow and outflow which has resulted from the…
Q: Common-Size Income Statement 2016 Revenues $ 29,970 % Cost of goods sold Gross profit Operating…
A: Common size analysis means where each item of balance sheet is expressed in form of percentage and…
Q: Common-Size Income Statement 2016 Revenues $ 29,970 % Cost of goods sold (20,030) $ 9,940 Gross…
A: Common Size Income Statements are presenting Income Statements in a way in which all the revenues…
Q: Income statement for the year ended 31 December, 2019 of KKMTN Ghana Ltd 2018 2019 ȼ ‘000 ȼ ‘000…
A: Computation:
Q: Plano Corporation reported net income P24,000; net sales P400,000; and average assets P600,000 for…
A: Given that: Net Income = P24000 Net Sales = P400,000
Q: alculate EVA from the following data for the year ended 31st March 2017. Average Debt…
A: Economic value added = Net operating Profit after tax - (Capital employed * Weighted average cost of…
Q: INCOME STATEMENT OF QUICK BURGER CORP., 2016 (Figures in $ millions) $ 27,587 17,589 1,422 $ 8,576…
A: Free cash flows are the amount of cash from operations after incurring capital expenditures. It is…
Q: Using the financial statements in the image, calculate the following ratios for both the FY 2017 and…
A: Ratio analysis is a tool used by the various people to analyze the financial statement of a company.…
Q: Fixed assets 267.5 million Sales…
A: Current Ratio = Current AssetsCurrent liabilities 3.10 = Current Assets…
Q: Net income $127,530 Enterest expense 11,093 Average total assets 2,069,000
A: Return on assets is calculated by dividing Earning before interest and taxes by average total…
Q: The following financial data is from Hi-Tech Instruments' financial statements (thousands of…
A: Dividends paid per share = Total dividend paid / No. of common stock
Q: Steele Inc. Consolidated Income Statements (in thousands except per share amounts) 2019 2018 2017…
A: Profit Margin = Net IncomeNet Sales Profit Margin for 2019 = 391,1797,245,088=0.05 Profit Margin for…
Q: Use the following information for Taco Swell, Inc., (assume the tax rate is 24 percent): 2017…
A: Balance Sheet Formula used in the above sheet
Q: Central Bank has the following information (in $million). 2017 ($ million) 2018 ($ million)…
A: The ratios from one period to another can be compared to identify the trends in the ratios.
Q: Home depot entered fiscal 2017 with a total capitalization of $21,940 million. In 2017 debt…
A: Measure company's financial performance based on the residual wealth. Economic value added (EVA) =…
Q: Net Income Net Assets P 2,000,000 P 7,800,000 8,700,000 9,000,000 2018 2019 2,500,000 2020 3,900,000…
A: The Details are given for the comapny who want to acquire another company. Required Calculate…
Q: Comment on the changes between these two years. What do the changes in ROA mean?
A: The amount of returns which is calculated by the company by dividing the annual net income that is…
Q: Using the financial statements in the image, calculate the following ratios for both the FY 2017 and…
A: Ratio analysis is a tool used by the various people to analyze the financial statement of a company.…
Q: Assume that for the 2017 fiscal year, AstroCo reported sales revenue of $4.8 billion and cost of…
A: Answer 1) Calculation of Current Ratio for 2017 Current Ratio = Current Assets/ Current Liabilities…
Q: Laris Corporation Income Statement For the year ended December 31, 2019 Sales revenue Cost of goods…
A: Cash flow statement (CFS) is the summary showing the net cash inflows and outflows by the entity for…
Q: How do you calculate Income Tax using? What are the permanent differences and the temporary…
A: Income tax is the compulsory liability being paid to the government or respective taxation…
Q: NATIONAL CO.: INCOME STATEMENTS FOR YEAR ENDING DECEMBER 31 (MILLIONS OF PHP) 2022 P3,600.0 P3,000.0…
A: Ratio Analysis - The ratio is the technique used by the prospective investor or an individual or…
How would I use this data to calculate Asset Turnover & Profit Margin for the DuPont Model.

Step by step
Solved in 2 steps


- SME Balance Sheet 2021 2020 Assets (in millions) Cash 85.960 56.460 Receivables 89.560 80.670 Inventories 55.750 41.260 Other Current Assets 9.950 6.760 Total Current Assets 241.220 185.150 Net Property, Plant, and Equipment 78.970 68.930 Goodwill and Other Intangible Assets 103.110 104.360 Other Non-Current Assets 6.900 4.200 Total Assets 430.200 362.640 Total Liabilities and Shareholders' Equity Payables 83.240 57.48 Current Debt 2.700 2.64 Total Current Liabilities 85.940 60.120 Long-Term Debt 122.000 119.62 Other Liabilities 21.880 22.58 Total Liabilities 229.820 202.320 Common Stock 200.380 160.32 Total Equity 200.38 160.32 Total Liabilities and Equity 430.200 362.640 INCOME STATEMENT 2021 Total Revenue (M) 488.10…SME Balance Sheet 2021 2020 Assets (in millions) Cash 85.960 56.460 Receivables 89.560 80.670 Inventories 55.750 41.260 Other Current Assets 9.950 6.760 Total Current Assets 241.220 185.150 Net Property, Plant, and Equipment 78.970 68.930 Goodwill and Other Intangible Assets 103.110 104.360 Other Non-Current Assets 6.900 4.200 Total Assets 430.200 362.640 Total Liabilities and Shareholders' Equity Payables 83.240 57.48 Current Debt 2.700 2.64 Total Current Liabilities 85.940 60.120 Long-Term Debt 122.000 119.62 Other Liabilities 21.880 22.58 Total Liabilities 229.820 202.320 Common Stock 200.380 160.32 Total Equity 200.38 160.32 Total Liabilities and Equity 430.200 362.640 INCOME STATEMENT 2021 Total Revenue (M) 488.10…SME Balance Sheet 2021 2020 Assets (in millions) Cash 85.960 56.460 Receivables 89.560 80.670 Inventories 55.750 41.260 Other Current Assets 9.950 6.760 Total Current Assets 241.220 185.150 Net Property, Plant, and Equipment 78.970 68.930 Goodwill and Other Intangible Assets 103.110 104.360 Other Non-Current Assets 6.900 4.200 Total Assets 430.200 362.640 Total Liabilities and Shareholders' Equity Payables 83.240 57.48 Current Debt 2.700 2.64 Total Current Liabilities 85.940 60.120 Long-Term Debt 122.000 119.62 Other Liabilities 21.880 22.58 Total Liabilities 229.820 202.320 Common Stock 200.380 160.32 Total Equity 200.38 160.32 Total Liabilities and Equity 430.200 362.640 INCOME STATEMENT 2021 Total Revenue (M) 488.10…
- SME Balance Sheet 2021 2020 Assets (in millions) Cash 85.960 56.460 Receivables 89.560 80.670 Inventories 55.750 41.260 Other Current Assets 9.950 6.760 Total Current Assets 241.220 185.150 Net Property, Plant, and Equipment 78.970 68.930 Goodwill and Other Intangible Assets 103.110 104.360 Other Non-Current Assets 6.900 4.200 Total Assets 430.200 362.640 Total Liabilities and Shareholders' Equity Payables 83.240 57.48 Current Debt 2.700 2.64 Total Current Liabilities 85.940 60.120 Long-Term Debt 122.000 119.62 Other Liabilities 21.880 22.58 Total Liabilities 229.820 202.320 Common Stock 200.380 160.32 Total Equity 200.38 160.32 Total Liabilities and Equity 430.200 362.640 INCOME STATEMENT 2021 Total Revenue (M) 488.10…SME Balance Sheet 2021 2020 Assets (in millions) Cash 85.960 56.460 Receivables 89.560 80.670 Inventories 55.750 41.260 Other Current Assets 9.950 6.760 Total Current Assets 241.220 185.150 Net Property, Plant, and Equipment 78.970 68.930 Goodwill and Other Intangible Assets 103.110 104.360 Other Non-Current Assets 6.900 4.200 Total Assets 430.200 362.640 Total Liabilities and Shareholders' Equity Payables 83.240 57.48 Current Debt 2.700 2.64 Total Current Liabilities 85.940 60.120 Long-Term Debt 122.000 119.62 Other Liabilities 21.880 22.58 Total Liabilities 229.820 202.320 Common Stock 200.380 160.32 Total Equity 200.38 160.32 Total Liabilities and Equity 430.200 362.640 INCOME STATEMENT 2021 Total Revenue (M) 488.10…SME Balance Sheet 2021 2020 Assets (in millions) Cash 85.960 56.460 Receivables 89.560 80.670 Inventories 55.750 41.260 Other Current Assets 9.950 6.760 Total Current Assets 241.220 185.150 Net Property, Plant, and Equipment 78.970 68.930 Goodwill and Other Intangible Assets 103.110 104.360 Other Non-Current Assets 6.900 4.200 Total Assets 430.200 362.640 Total Liabilities and Shareholders' Equity Payables 83.240 57.48 Current Debt 2.700 2.64 Total Current Liabilities 85.940 60.120 Long-Term Debt 122.000 119.62 Other Liabilities 21.880 22.58 Total Liabilities 229.820 202.320 Common Stock 200.380 160.32 Total Equity 200.38 160.32 Total Liabilities and Equity 430.200 362.640 INCOME STATEMENT 2021 Total Revenue (M) 488.10…
- SME Balance Sheet 2021 2020 Assets (in millions) Cash 85.960 56.460 Receivables 89.560 80.670 Inventories 55.750 41.260 Other Current Assets 9.950 6.760 Total Current Assets 241.220 185.150 Net Property, Plant, and Equipment 78.970 68.930 Goodwill and Other Intangible Assets 103.110 104.360 Other Non-Current Assets 6.900 4.200 Total Assets 430.200 362.640 Total Liabilities and Shareholders' Equity Payables 83.240 57.48 Current Debt 2.700 2.64 Total Current Liabilities 85.940 60.120 Long-Term Debt 122.000 119.62 Other Liabilities 21.880 22.58 Total Liabilities 229.820 202.320 Common Stock 200.380 160.32 Total Equity 200.38 160.32 Total Liabilities and Equity 430.200 362.640 INCOME STATEMENT 2021 Total Revenue (M) 488.10…SME Balance Sheet 2021 2020 Assets (in millions) Cash 85.960 56.460 Receivables 89.560 80.670 Inventories 55.750 41.260 Other Current Assets 9.950 6.760 Total Current Assets 241.220 185.150 Net Property, Plant, and Equipment 78.970 68.930 Goodwill and Other Intangible Assets 103.110 104.360 Other Non-Current Assets 6.900 4.200 Total Assets 430.200 362.640 Total Liabilities and Shareholders' Equity Payables 83.240 57.48 Current Debt 2.700 2.64 Total Current Liabilities 85.940 60.120 Long-Term Debt 122.000 119.62 Other Liabilities 21.880 22.58 Total Liabilities 229.820 202.320 Common Stock 200.380 160.32 Total Equity 200.38 160.32 Total Liabilities and Equity 430.200 362.640 INCOME STATEMENT 2021 Total Revenue (M) 488.10…39 Atlanta Corporation, a domestic corporation, had the following data for the years 2022 and 2023: 2022 2023 Sales P 10,000,000 P 15,000,000 Cost of sales 4,000,000 6,000,000 Deductible expenses 6,100,000 7,000,000 Capital gains 50,000 100,000 Interest income on trade notes receivable 10,000 30,000 Rent income 430,000 600,000 Total assets 500,000,000 550,000,000 How much is the total deferred charges in 2023?
- tion 8Income statement for the year ended 31 December, 2019 of KKMTN Ghana Ltd2018 2019ȼ ‘000 ȼ ‘000Turnover 420,000 523,600Cost of sales (330,000) (417,200)Gross profit 89,000 106,400Expenses:Administration 44,600 50,200Selling and distribution 15,400 (60,000) 19,600 (69,800)Profit before interest 29,000 36,600Debenture interest - (2,800)Net profit before tax 29,000 33,800Taxation (8,000) (10,000)Net Profit after tax 21,000 23,800Ordinary dividend paid 8,400 9,250Ordinary shares issued 12 million and trading at ȼ3 each as at yesterday onGSE.You are required to compute the following investment ratios:a). Earnings per shareb). Dividend per sharec). Payout ratiod). Price earnings ratioe). Earnings yieldINCOME STATEMENT Year ended June 30 2022 2021 $'000 $'000Revenue 22450 18675Cost of sales 8475 8055Gross Profit 13975 10620Distribution costs 4245 3120Administrative expenses 1276 2134Selling expenses…E10.18 (LO 5), AN Suppose the following financial data were reported by 3M Company for 2021 and 2022 (dollars in millions). 3M CompanyBalance Sheets (partial) 2022 2021 Current assets Cash and cash equivalents $ 3,040 $1,849 Accounts receivable, net 3,250 3,195 Inventories 2,639 3,013 Other current assets 1,866 1,541 Total current assets $10,795 $9,598 Current liabilities $ 4,897 $5,839 Instructions Calculate the current ratio and working capital for 3M for 2021 and 2022. Suppose that at the end of 2022, 3M management used $300 million cash to pay off $300 million of accounts payable. How would its current ratio and working capital have changed?


