Wendys Wendys Annual Data | Millions of US $ except per share data 2018-12-31 2017-12-31 2016-12-31 2018-12-31 Annual Data | Millions of US $ except per share data 2017-12-31 Net Income/Loss Llal $460.115 $194.029 $129.624 Llul $1,589.936 $1,223.408 Total Depreciation And Amortization - Cash Flow $128.879 $125.687 $124.304 Revenue $-44.001 Llal $-51.505 Cost Of Goods Sold Other Non-Cash Items $-427.333 Lal $573.791 $534.26 Llil $74.182 Total Non-Cash Items S-298.454 $80.303 $1,016.145 $689.148 Gross Profit Change In Accounts Receivable $13.226 $-17.34 $-34.213 Research And Development Expenses $-0.434 Lll $-0.305 $0.034 Change In Inventories Llul SG&A Expenses $539.355 $203.593 S-0.145 $-6.635 Llal $-2.29 Change In Accounts Payable Other Operating Income Or Expenses $-34.521 $2.153 $20.779 $-15.718 Change In Assets/Liabilities Lal $2.296 Lll Operating Expenses $1,340.044 $1,008.65 Total Change In Assets/Liabilities Llal $57.389 S-30.671 S-19.821 Cash Flow From Operating Activities Llal $224.228 $238.793 $193.825 Lll $249.892 $214.758 Operating Income Llal $-69.857 $-81.71 $-150.023 Net Change In Property, Plant, And Equipment Total Non-Operating Income/Expense $325.024 $-113.739 Net Change In Intangible Assets Pre-Tax Income $574.916 $101.019 $-18.178 $-5.272 $259.964 Net Acquisitions/Divestitures Income Taxes $114.801 $-93.01 Net Change In Short-term Investments $460.115 $194.029 Income After Taxes $3.736 Net Change In Long-Term Investments Lal $449.987 $0.718 Other Income $449.987 Net Change In Investments - Total Llal $3.736 $0.718 Investing Activities - Other Llal Lll $0.959 $-9 $-3.581 $460.115 $194.029 Income From Continuous Operations Cash Flow From Investing Activities Llul $362.911 $-92.246 $107.078 Income From Discontinued Operations Net Long-Term Debt Lll $34.765 $-26.983 $-24.617 $460.115 $194.029 Net Income Net Current Debt Lll EBITDA $378.771 $340.445 Lal $34.765 S-26.983 S-24.617 Debt Issuance/Retirement Net - Total Lll $214.758 EBIT $249.892 Net Common Equity Issued/Repurchased Llal S-224.581 $-113.347 $-317.185 Basic Shares Outstanding 238 244 $-317.185 Net Total Equity Issued/Repurchased Llal $-224.581 $-113.347 S-63.832 Llal Lal Shares Outstanding Total Common And Preferred Stock Dividends Paid $-80.532 S-68.322 245 252 Llal $-35.414 $-7.145 Financial Activities - Other $-6.427 Lll $1.93 $0.79 Basic EPS Cash Flow From Financial Activities $-412.061 Llal $-305.762 $-215.797 $1.88 $0.77 EPS - Earnings Per Share Net Cash Flow Llal $273.688 $-63.125 $-109.031 Wendys Stock-Based Compensation Llal $17.918 $20.928 $18.141 Lal $-80.532 $-68.322 $-63.832 Common Stock Dividends Paid Wendys Annual Data | Millions of US $ except per share data 2018-12-31 2017-12-31 2017-12-31 Annual Data 2018-12-31 Cash On Hand $461.265 $204.08 Notes And Loans Receivable Llal Current Ratio 2.3426 1.78 $3.687 $3.156 Inventory Llul 0.8093 0.8262 Long-term Debt / Capital $76.509 $62.602 Other Current Assets Debt/Equity Ratio 4.8053 4.294 Lll $665.718 $404.353 Total Current Assets Lll Gross Margin 63.9111 56.3302 Llul $1,213.236 $1,263.059 Property, Plant, And Equipment 17.5541 Operating Margin 15.7171 Llal $285.091 Long-Term Investments $274.137 Lll EBIT Margin 17.5541 15.7171 Lll $2,042.037 $2,064.919 Goodwill And Intangible Assets EBITDA Margin 23.823 27.8276 Other Long-Term Assets $96.907 $79.516 Llal Pre-Tax Profit Margin 36.1597 8.2572 Total Long-Term Assets $3,626.317 $3,692.585 Llul Net Profit Margin 28.9392 15.8597 Lal $4,292.035 $4,096.938 Total Assets Llul Asset Turnover 0.3704 0.2986 $284.185 $227.162 Total Current Liabilities Inventory Turnover Ratio 155.6254 169.2839 Lll $2,752.783 $2,724.23 Long Term Debt Lll Receiveable Turnover 14.4796 10.6951 $337.458 $273.29 Other Non-Current Liabilities Days Sales In Receivables 25.2078 34.1279 Llal $3,296.573 $3,359.401 Total Long Term Liabilities ROE - Return On Equity Lll 70.9562 33.85 Lal Total Liabilities $3,643.586 $3,523.735 Llal Return On Tangible Equity -33.0166 -13.0071 Lal $47.042 $47.042 Common Stock Net Lll ROA - Return On Assets 4.736 10.7202 Lll $-163.289 Retained Earnings (Accumulated Deficit) $146.277 ROI - Return On Investment Lll 13.5279 5.8842 $-46.198 Comprehensive Income $-61.673 Llal Book Value Per Share 2.8043 2.3833 Llul Other Share Holders Equity Llul 0.9465 Operating Cash Flow Per Share 0.9154 Share Holder Equity $648.449 $573.203 Llul 0.6226 Free Cash Flow Per Share 0.6302 $4,292.035 $4,096.938 Total Liabilities And Share Holders Equity EEEE E E E E | E E E E E EE 333333333
Wendys Wendys Annual Data | Millions of US $ except per share data 2018-12-31 2017-12-31 2016-12-31 2018-12-31 Annual Data | Millions of US $ except per share data 2017-12-31 Net Income/Loss Llal $460.115 $194.029 $129.624 Llul $1,589.936 $1,223.408 Total Depreciation And Amortization - Cash Flow $128.879 $125.687 $124.304 Revenue $-44.001 Llal $-51.505 Cost Of Goods Sold Other Non-Cash Items $-427.333 Lal $573.791 $534.26 Llil $74.182 Total Non-Cash Items S-298.454 $80.303 $1,016.145 $689.148 Gross Profit Change In Accounts Receivable $13.226 $-17.34 $-34.213 Research And Development Expenses $-0.434 Lll $-0.305 $0.034 Change In Inventories Llul SG&A Expenses $539.355 $203.593 S-0.145 $-6.635 Llal $-2.29 Change In Accounts Payable Other Operating Income Or Expenses $-34.521 $2.153 $20.779 $-15.718 Change In Assets/Liabilities Lal $2.296 Lll Operating Expenses $1,340.044 $1,008.65 Total Change In Assets/Liabilities Llal $57.389 S-30.671 S-19.821 Cash Flow From Operating Activities Llal $224.228 $238.793 $193.825 Lll $249.892 $214.758 Operating Income Llal $-69.857 $-81.71 $-150.023 Net Change In Property, Plant, And Equipment Total Non-Operating Income/Expense $325.024 $-113.739 Net Change In Intangible Assets Pre-Tax Income $574.916 $101.019 $-18.178 $-5.272 $259.964 Net Acquisitions/Divestitures Income Taxes $114.801 $-93.01 Net Change In Short-term Investments $460.115 $194.029 Income After Taxes $3.736 Net Change In Long-Term Investments Lal $449.987 $0.718 Other Income $449.987 Net Change In Investments - Total Llal $3.736 $0.718 Investing Activities - Other Llal Lll $0.959 $-9 $-3.581 $460.115 $194.029 Income From Continuous Operations Cash Flow From Investing Activities Llul $362.911 $-92.246 $107.078 Income From Discontinued Operations Net Long-Term Debt Lll $34.765 $-26.983 $-24.617 $460.115 $194.029 Net Income Net Current Debt Lll EBITDA $378.771 $340.445 Lal $34.765 S-26.983 S-24.617 Debt Issuance/Retirement Net - Total Lll $214.758 EBIT $249.892 Net Common Equity Issued/Repurchased Llal S-224.581 $-113.347 $-317.185 Basic Shares Outstanding 238 244 $-317.185 Net Total Equity Issued/Repurchased Llal $-224.581 $-113.347 S-63.832 Llal Lal Shares Outstanding Total Common And Preferred Stock Dividends Paid $-80.532 S-68.322 245 252 Llal $-35.414 $-7.145 Financial Activities - Other $-6.427 Lll $1.93 $0.79 Basic EPS Cash Flow From Financial Activities $-412.061 Llal $-305.762 $-215.797 $1.88 $0.77 EPS - Earnings Per Share Net Cash Flow Llal $273.688 $-63.125 $-109.031 Wendys Stock-Based Compensation Llal $17.918 $20.928 $18.141 Lal $-80.532 $-68.322 $-63.832 Common Stock Dividends Paid Wendys Annual Data | Millions of US $ except per share data 2018-12-31 2017-12-31 2017-12-31 Annual Data 2018-12-31 Cash On Hand $461.265 $204.08 Notes And Loans Receivable Llal Current Ratio 2.3426 1.78 $3.687 $3.156 Inventory Llul 0.8093 0.8262 Long-term Debt / Capital $76.509 $62.602 Other Current Assets Debt/Equity Ratio 4.8053 4.294 Lll $665.718 $404.353 Total Current Assets Lll Gross Margin 63.9111 56.3302 Llul $1,213.236 $1,263.059 Property, Plant, And Equipment 17.5541 Operating Margin 15.7171 Llal $285.091 Long-Term Investments $274.137 Lll EBIT Margin 17.5541 15.7171 Lll $2,042.037 $2,064.919 Goodwill And Intangible Assets EBITDA Margin 23.823 27.8276 Other Long-Term Assets $96.907 $79.516 Llal Pre-Tax Profit Margin 36.1597 8.2572 Total Long-Term Assets $3,626.317 $3,692.585 Llul Net Profit Margin 28.9392 15.8597 Lal $4,292.035 $4,096.938 Total Assets Llul Asset Turnover 0.3704 0.2986 $284.185 $227.162 Total Current Liabilities Inventory Turnover Ratio 155.6254 169.2839 Lll $2,752.783 $2,724.23 Long Term Debt Lll Receiveable Turnover 14.4796 10.6951 $337.458 $273.29 Other Non-Current Liabilities Days Sales In Receivables 25.2078 34.1279 Llal $3,296.573 $3,359.401 Total Long Term Liabilities ROE - Return On Equity Lll 70.9562 33.85 Lal Total Liabilities $3,643.586 $3,523.735 Llal Return On Tangible Equity -33.0166 -13.0071 Lal $47.042 $47.042 Common Stock Net Lll ROA - Return On Assets 4.736 10.7202 Lll $-163.289 Retained Earnings (Accumulated Deficit) $146.277 ROI - Return On Investment Lll 13.5279 5.8842 $-46.198 Comprehensive Income $-61.673 Llal Book Value Per Share 2.8043 2.3833 Llul Other Share Holders Equity Llul 0.9465 Operating Cash Flow Per Share 0.9154 Share Holder Equity $648.449 $573.203 Llul 0.6226 Free Cash Flow Per Share 0.6302 $4,292.035 $4,096.938 Total Liabilities And Share Holders Equity EEEE E E E E | E E E E E EE 333333333

Intermediate Accounting: Reporting And Analysis
3rd Edition
ISBN:9781337788281
Author:James M. Wahlen, Jefferson P. Jones, Donald Pagach
Publisher:James M. Wahlen, Jefferson P. Jones, Donald Pagach
Chapter5: The Income Statement And The Statement Of Cash Flows
Section: Chapter Questions
Problem 5E: Multiple-Step and Single-Step In coin Statements The following items were derived from Gold...

Related questions
Question
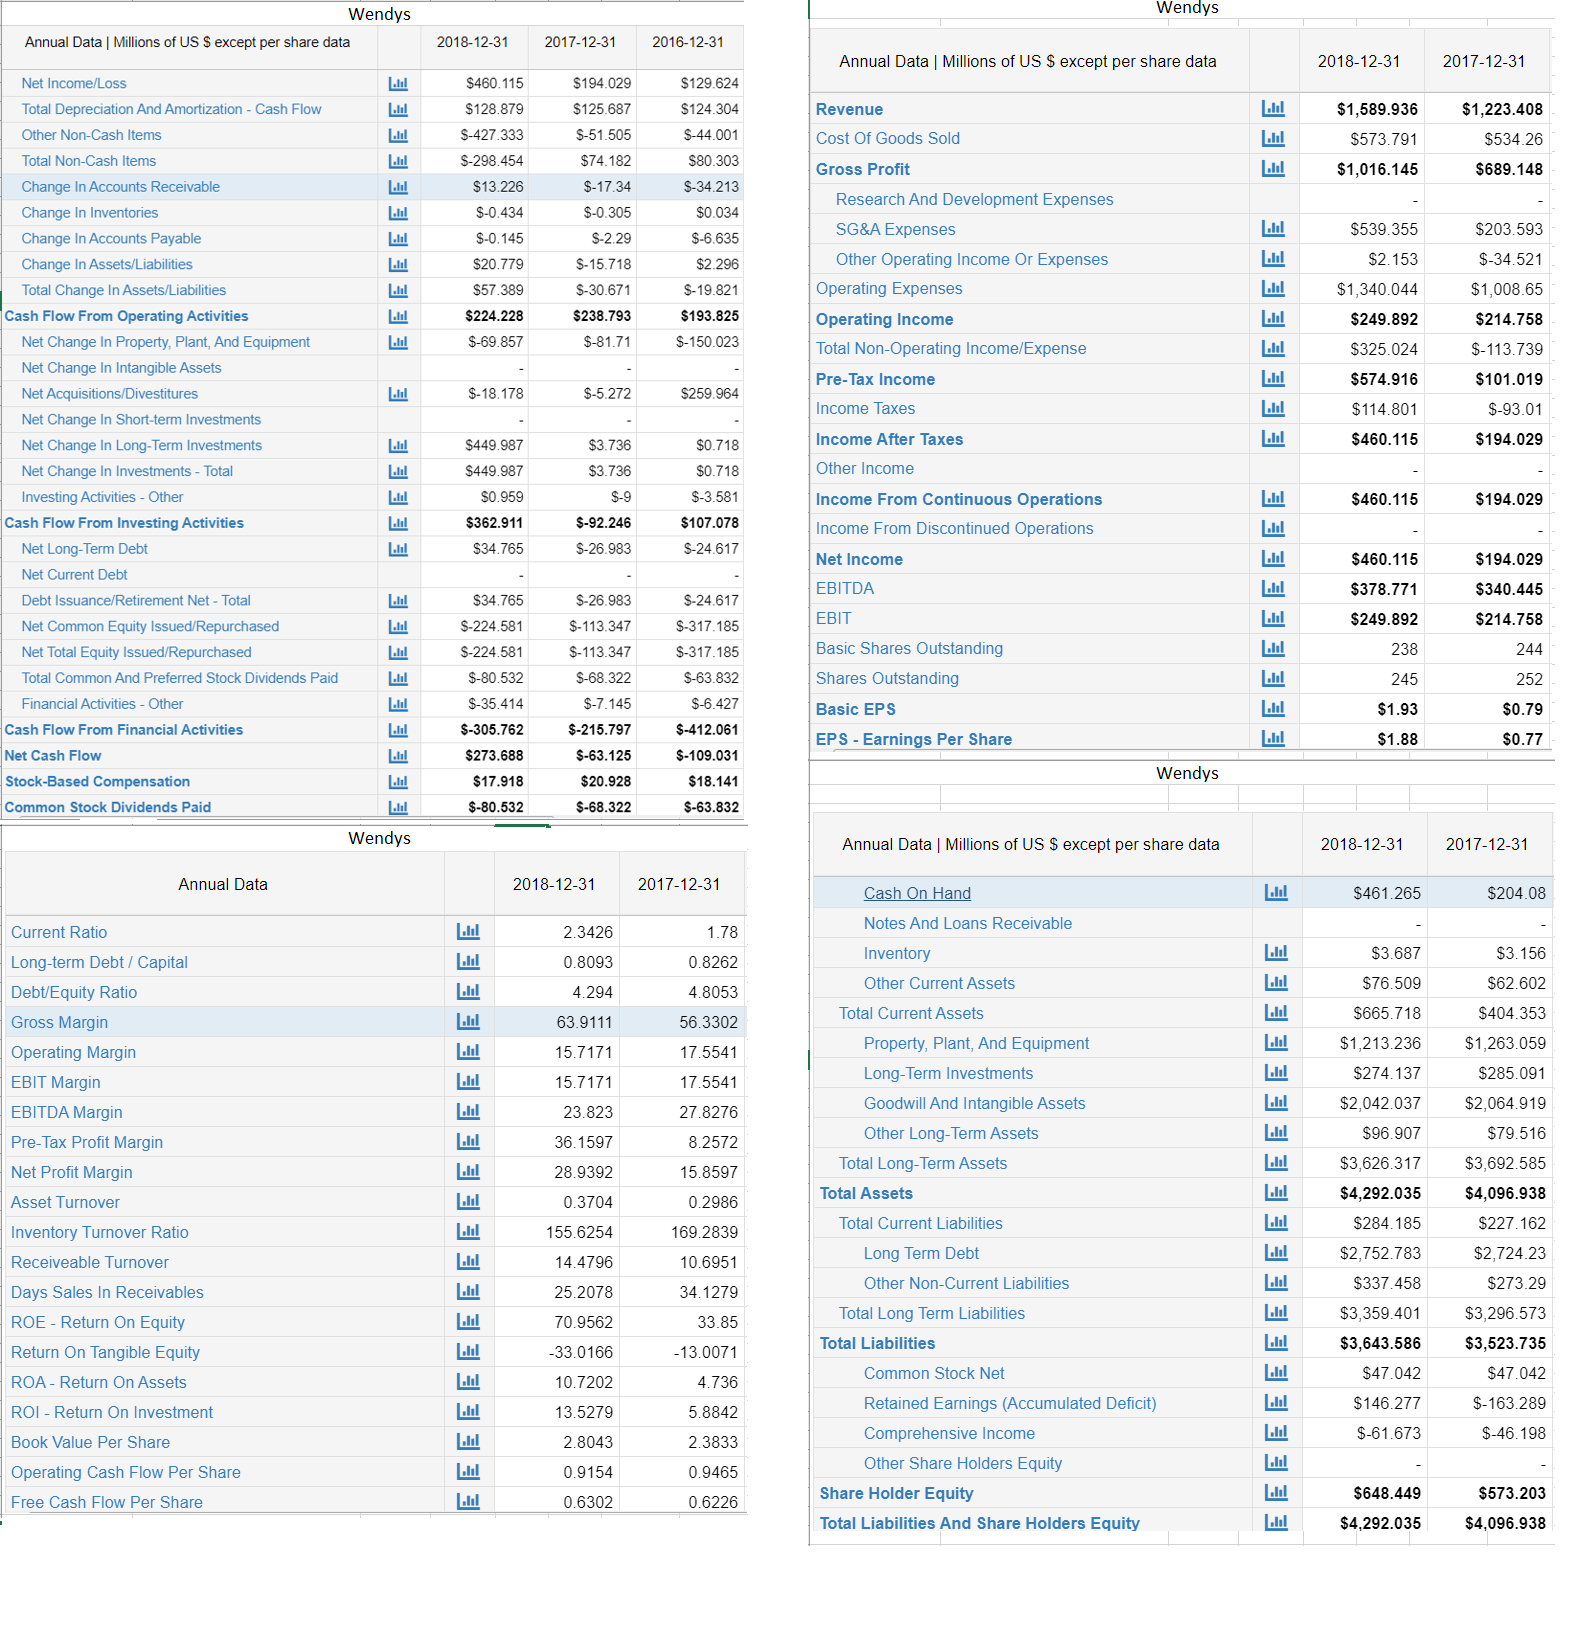
Using the financial statements in the image, calculate the following ratios for both the FY 2017 and FY 2018:
- Current Ratio
- Quick Ratio
- Total Asset Turnover
- Average Collection
- Total Debt to Total Assets
- Times Interest Earned
- Net Profit Margin
Return on Assets Return on Equity - Modified Du Point Equation for FY 2018
- PE Ratio
- Market to Book Ratio
Transcribed Image Text:Wendys
Wendys
Annual Data | Millions of US $ except per share data
2018-12-31
2017-12-31
2016-12-31
2018-12-31
Annual Data | Millions of US $ except per share data
2017-12-31
Net Income/Loss
Llal
$460.115
$194.029
$129.624
Llul
$1,589.936
$1,223.408
Total Depreciation And Amortization - Cash Flow
$128.879
$125.687
$124.304
Revenue
$-44.001
Llal
$-51.505
Cost Of Goods Sold
Other Non-Cash Items
$-427.333
Lal
$573.791
$534.26
Llil
$74.182
Total Non-Cash Items
S-298.454
$80.303
$1,016.145
$689.148
Gross Profit
Change In Accounts Receivable
$13.226
$-17.34
$-34.213
Research And Development Expenses
$-0.434
Lll
$-0.305
$0.034
Change In Inventories
Llul
SG&A Expenses
$539.355
$203.593
S-0.145
$-6.635
Llal
$-2.29
Change In Accounts Payable
Other Operating Income Or Expenses
$-34.521
$2.153
$20.779
$-15.718
Change In Assets/Liabilities
Lal
$2.296
Lll
Operating Expenses
$1,340.044
$1,008.65
Total Change In Assets/Liabilities
Llal
$57.389
S-30.671
S-19.821
Cash Flow From Operating Activities
Llal
$224.228
$238.793
$193.825
Lll
$249.892
$214.758
Operating Income
Llal
$-69.857
$-81.71
$-150.023
Net Change In Property, Plant, And Equipment
Total Non-Operating Income/Expense
$325.024
$-113.739
Net Change In Intangible Assets
Pre-Tax Income
$574.916
$101.019
$-18.178
$-5.272
$259.964
Net Acquisitions/Divestitures
Income Taxes
$114.801
$-93.01
Net Change In Short-term Investments
$460.115
$194.029
Income After Taxes
$3.736
Net Change In Long-Term Investments
Lal
$449.987
$0.718
Other Income
$449.987
Net Change In Investments - Total
Llal
$3.736
$0.718
Investing Activities - Other
Llal
Lll
$0.959
$-9
$-3.581
$460.115
$194.029
Income From Continuous Operations
Cash Flow From Investing Activities
Llul
$362.911
$-92.246
$107.078
Income From Discontinued Operations
Net Long-Term Debt
Lll
$34.765
$-26.983
$-24.617
$460.115
$194.029
Net Income
Net Current Debt
Lll
EBITDA
$378.771
$340.445
Lal
$34.765
S-26.983
S-24.617
Debt Issuance/Retirement Net - Total
Lll
$214.758
EBIT
$249.892
Net Common Equity Issued/Repurchased
Llal
S-224.581
$-113.347
$-317.185
Basic Shares Outstanding
238
244
$-317.185
Net Total Equity Issued/Repurchased
Llal
$-224.581
$-113.347
S-63.832
Llal
Lal
Shares Outstanding
Total Common And Preferred Stock Dividends Paid
$-80.532
S-68.322
245
252
Llal
$-35.414
$-7.145
Financial Activities - Other
$-6.427
Lll
$1.93
$0.79
Basic EPS
Cash Flow From Financial Activities
$-412.061
Llal
$-305.762
$-215.797
$1.88
$0.77
EPS - Earnings Per Share
Net Cash Flow
Llal
$273.688
$-63.125
$-109.031
Wendys
Stock-Based Compensation
Llal
$17.918
$20.928
$18.141
Lal
$-80.532
$-68.322
$-63.832
Common Stock Dividends Paid
Wendys
Annual Data | Millions of US $ except per share data
2018-12-31
2017-12-31
2017-12-31
Annual Data
2018-12-31
Cash On Hand
$461.265
$204.08
Notes And Loans Receivable
Llal
Current Ratio
2.3426
1.78
$3.687
$3.156
Inventory
Llul
0.8093
0.8262
Long-term Debt / Capital
$76.509
$62.602
Other Current Assets
Debt/Equity Ratio
4.8053
4.294
Lll
$665.718
$404.353
Total Current Assets
Lll
Gross Margin
63.9111
56.3302
Llul
$1,213.236
$1,263.059
Property, Plant, And Equipment
17.5541
Operating Margin
15.7171
Llal
$285.091
Long-Term Investments
$274.137
Lll
EBIT Margin
17.5541
15.7171
Lll
$2,042.037
$2,064.919
Goodwill And Intangible Assets
EBITDA Margin
23.823
27.8276
Other Long-Term Assets
$96.907
$79.516
Llal
Pre-Tax Profit Margin
36.1597
8.2572
Total Long-Term Assets
$3,626.317
$3,692.585
Llul
Net Profit Margin
28.9392
15.8597
Lal
$4,292.035
$4,096.938
Total Assets
Llul
Asset Turnover
0.3704
0.2986
$284.185
$227.162
Total Current Liabilities
Inventory Turnover Ratio
155.6254
169.2839
Lll
$2,752.783
$2,724.23
Long Term Debt
Lll
Receiveable Turnover
14.4796
10.6951
$337.458
$273.29
Other Non-Current Liabilities
Days Sales In Receivables
25.2078
34.1279
Llal
$3,296.573
$3,359.401
Total Long Term Liabilities
ROE - Return On Equity
Lll
70.9562
33.85
Lal
Total Liabilities
$3,643.586
$3,523.735
Llal
Return On Tangible Equity
-33.0166
-13.0071
Lal
$47.042
$47.042
Common Stock Net
Lll
ROA - Return On Assets
4.736
10.7202
Lll
$-163.289
Retained Earnings (Accumulated Deficit)
$146.277
ROI - Return On Investment
Lll
13.5279
5.8842
$-46.198
Comprehensive Income
$-61.673
Llal
Book Value Per Share
2.8043
2.3833
Llul
Other Share Holders Equity
Llul
0.9465
Operating Cash Flow Per Share
0.9154
Share Holder Equity
$648.449
$573.203
Llul
0.6226
Free Cash Flow Per Share
0.6302
$4,292.035
$4,096.938
Total Liabilities And Share Holders Equity
EEEE E E
E E |
E E E E E EE
333333333
Expert Solution


Trending now
This is a popular solution!

Step by step
Solved in 9 steps with 9 images

Knowledge Booster


Learn more about
Need a deep-dive on the concept behind this application? Look no further. Learn more about this topic, finance and related others by exploring similar questions and additional content below.Recommended textbooks for you
Intermediate Accounting: Reporting And Analysis
Accounting
ISBN:
9781337788281
Author:
James M. Wahlen, Jefferson P. Jones, Donald Pagach
Publisher:
Cengage Learning
Intermediate Accounting: Reporting And Analysis
Accounting
ISBN:
9781337788281
Author:
James M. Wahlen, Jefferson P. Jones, Donald Pagach
Publisher:
Cengage Learning