
MATLAB: An Introduction with Applications
6th Edition
ISBN: 9781119256830
Author: Amos Gilat
Publisher: John Wiley & Sons Inc
expand_more
expand_more
format_list_bulleted
Related questions
Question
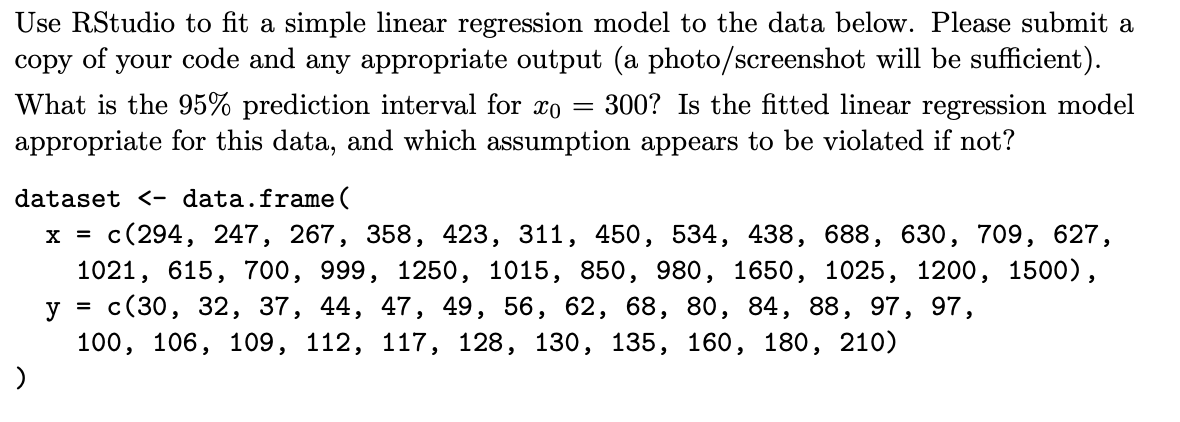

Transcribed Image Text:Use RStudio to fit a simple linear regression model to the data below. Please submit a
copy of your code and any appropriate output (a photo/screenshot will be sufficient).
300? Is the fitted linear regression model
What is the 95% prediction interval for xo =
appropriate for this data, and which assumption appears to be violated if not?
dataset <- data.frame (
с (294, 247, 267, 358, 423, 311, 450, 534, 438, 688, 630, 709, 627,
1021, 615, 700, 999, 1250, 1015, 850, 980, 1650, 1025, 1200, 1500),
у 3 с (30, 32, 37, 44, 47, 49, 56, 62, 68, 80, 84, 88, 97, 97,
100, 106, 109, 112, 117, 128, 130, 135, 160, 180, 210)
X =
%3D
Expert Solution
This question has been solved!
Explore an expertly crafted, step-by-step solution for a thorough understanding of key concepts.

Step by stepSolved in 3 steps

Knowledge Booster

Similar questions
- The accompanying data are the caloric contents and the sugar contents (in grams) of 11 high-fiber breakfast cereals. Find the equation of the regression line. Then construct a scatter plot of the data and draw the regression line. Then use the regression equation to predict the value of y for each of the given x-values, if meaningful. If the x-value is not meaningful to predict the value of y, explain why not. Calories, x Sugar, y 140 6 200 10 160 6 160 9 170 10 180 16 190 13 210 18 190 19 170 10 170 10 The equation of the regression line is ŷ = ______ x + ______ (Round the slope to three decimal places as needed. Round the y-intercept to two decimal places as needed.) (a) x = 150 cal, (b) x = 90 cal, (c) x = 175 cal, (d) x = 208 cal…arrow_forwardResearchers are interested in predicting the height of a child based on the heights of their mother and father. Data were collected, which included height of the child ( height), height of the mother ( mothersheight ), and height of the father (fathersheight ). The initial analysis used the heights of the parents to predict the height of the child (all units are inches). The results of the analysis, a multiple regression, are presented below. . regress height mothersheight fathersheight Source Model Residual Total height mothersheight fathersheight _cons SS 208.008457 314.295372 522.303829 df 2 104.004228 8.49446952 37 MS 39 13.3924059 Coef. Std. Err. .6579529 .1474763 .2003584 .1382237 9.804327 12.39987 t P>|t| 4.46 0.000 C 0.156 0.79 0.434 Number of obs = F( 2, 37) = Prob > F R-squared Adj R-squared = Root MSE = = .3591375 -.0797093 -15.32021 = 40 12.24 0.0001 0.3983 0.3657 2.9145 [95% Conf. Interval] .9567683 .4804261 34.92886 What are the null and alternative hypotheses…arrow_forwardThe accompanying data are the number of wins and the earned run averages (mean number of earned runs allowed per nine innings pitched) for eight baseball pitchers in a recent season. Find the equation of the regression line. Then construct a scatter plot of the data and draw the regression line. Then use the regression equation to predict the value of y for each of the given x-values, if meaningful. If the x-value is not meaningful to predict the value of y, explain why not. (a) x = 5 wins Click the icon to view the table of numbers of wins and earned run average. (b) x = 10 wins (c) x = 21 wins (d) x = 15 wins ERA 6- ERA 6- AERA 6- ERA 6- 4- 4- 4- 4- 2- 2- 2- 2- 0+ 6 0- 0- 0- 12 18 24 6. 12 18 24 12 18 24 6 12 18 24 Wins Wins Wins Wins (a) Predict the ERA for 5 wins, if it is meaningful. Select the correct choice below and, if necessary, fill in the answer box within your choice. A. ŷ= (Round to two decimal places as needed.) B. It is not meaningful to predict this value of y because…arrow_forward
- I need help with finding test statistic, thanksarrow_forwardPls help ASAP. Pls show all work.arrow_forwardThe data show the bug chirps per minute at different temperatures. Find the regression equation, letting the first variable be the independent (x) variable. Find the best predicted temperature for a time when a bug is chirping at the rate of 3000 chirps per minute. Use a significance level of 0.05. What is wrong with this predicted value? Chirps in 1 min 784 838 822 949 1188 813 Temperature (°F) 65.7 67.8 66.2 79.9 92.3 73.5 What is the regression equation? What is the best-predicted temperature for a time when a bug is chirping at the rate of 3000 chirps per minute? The best predicted temperature when a bug is chirping at 3000chirps per minute are? What is wrong with this predicted value? Choose the correct answer below. A. It is unrealistically high. The value 3000 is far outside of the range of observed values. B. The first variable should have been the dependent variable. C. It is only an…arrow_forward
- • When fitting a linear regression, multiple regression lines may be equally as good to represent the data. True O Falsearrow_forwardResearchers are interested in predicting the height of a child based on the heights of their mother and father. Data were collected, which included height of the child (height ), height of the mother ( mothersheight), and height of the father (fathersheight ). The initial analysis used the heights of the parents to predict the height of the child (all units are inches). The results of the analysis, a multiple regression, are presented below. . regress height mothersheight fathersheight Source Model Residual Total height mothersheight fathersheight _cons SS df 208.008457 314.295372 37 2 104.004228 8.49446952 MS 522.303829 39 13.3924059 Coef. Std. Err. .6579529 .1474763 .2003584 .1382237 9.804327 12.39987 t P>|t| 4.46 0.000 C 0.156 0.79 0.434 Number of obs = F( 2, 37) = Prob > F R-squared Adj R-squared Root MSE = .3591375 -.0797093 -15.32021 = 40 12.24 0.0001 0.3983 0.3657 2.9145 [95% Conf. Interval] .9567683 .4804261 34.92886 What is the predicted height for a child born to a mother…arrow_forwardThe data show the bug chirps per minute at different temperatures. Find the regression equation, letting the first variable be the independent (x) variable. Find the best predicted temperature for a time when a bug is chirping at the rate of 3000 chirps per minute. Use a significance level of 0.05. What is wrong with this predicted value? Chirps in 1 min 760 1119 1125 850 965 785 D Temperature (°F) 70.5 90.8 90.8 74.7 77.1 69.9 What is the regression equation? (Round the x-coefficient to four decimal places as needed. Round the constant to two decimal places as needed.)arrow_forward
arrow_back_ios
SEE MORE QUESTIONS
arrow_forward_ios
Recommended textbooks for you
- MATLAB: An Introduction with ApplicationsStatisticsISBN:9781119256830Author:Amos GilatPublisher:John Wiley & Sons Inc
 Probability and Statistics for Engineering and th...StatisticsISBN:9781305251809Author:Jay L. DevorePublisher:Cengage Learning
 Statistics for The Behavioral Sciences (MindTap C...StatisticsISBN:9781305504912Author:Frederick J Gravetter, Larry B. WallnauPublisher:Cengage Learning
  Elementary Statistics: Picturing the World (7th E...StatisticsISBN:9780134683416Author:Ron Larson, Betsy FarberPublisher:PEARSON
 The Basic Practice of StatisticsStatisticsISBN:9781319042578Author:David S. Moore, William I. Notz, Michael A. FlignerPublisher:W. H. Freeman
 Introduction to the Practice of StatisticsStatisticsISBN:9781319013387Author:David S. Moore, George P. McCabe, Bruce A. CraigPublisher:W. H. Freeman
MATLAB: An Introduction with Applications
Statistics
ISBN:9781119256830
Author:Amos Gilat
Publisher:John Wiley & Sons Inc
Probability and Statistics for Engineering and th...
Statistics
ISBN:9781305251809
Author:Jay L. Devore
Publisher:Cengage Learning
Statistics for The Behavioral Sciences (MindTap C...
Statistics
ISBN:9781305504912
Author:Frederick J Gravetter, Larry B. Wallnau
Publisher:Cengage Learning
Elementary Statistics: Picturing the World (7th E...
Statistics
ISBN:9780134683416
Author:Ron Larson, Betsy Farber
Publisher:PEARSON
The Basic Practice of Statistics
Statistics
ISBN:9781319042578
Author:David S. Moore, William I. Notz, Michael A. Fligner
Publisher:W. H. Freeman
Introduction to the Practice of Statistics
Statistics
ISBN:9781319013387
Author:David S. Moore, George P. McCabe, Bruce A. Craig
Publisher:W. H. Freeman