
MATLAB: An Introduction with Applications
6th Edition
ISBN: 9781119256830
Author: Amos Gilat
Publisher: John Wiley & Sons Inc
expand_more
expand_more
format_list_bulleted
Related questions
Question
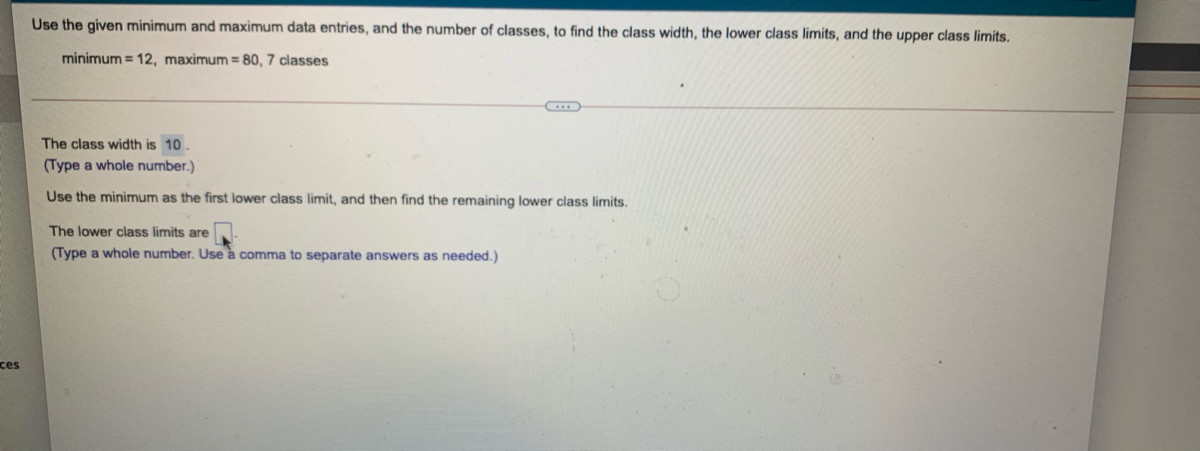

Transcribed Image Text:Use the given minimum and maximum data entries, and the number of classes, to find the class width, the lower class limits, and the upper class limits.
minimum = 12, maximum = 80, 7 classes
The class width is 10
(Type a whole number.)
Use the minimum as the first lower class limit, and then find the remaining lower class limits.
The lower class limits are
(Type a whole number. Use à comma to separate answers as needed.)
ces
Expert Solution
arrow_forward
Step 1

Trending nowThis is a popular solution!

Step by stepSolved in 2 steps with 2 images

Knowledge Booster

Similar questions
- Find the g.c.f. and I.c.m. of the set of numbers. {60, 120, 135} g.c.f. 15 I.c.m. 60 60 Xarrow_forwardthe choice d:How many shooting stars i can see at nightarrow_forwardDetermine the mode of the set of values. (Enter your answers as a comma-separated list. If there is no answer, enter NONE.) 29 53 47 29 31 77 44 62 29 77 12 16arrow_forward
- Twelve friends are to arrange themselves in a straight line for a group photo. How many ways can these twelve people arrange themselves? A. 5,040 B. 12 C. 95,040 D. 479,001,600arrow_forwardDetermine the original set of data. 1 0 16 2 14479 3355578 401 Legend: 110 represents 10 The original set of data is 10,11,16,21,24,24,27,28,33,35,35,35,37,39,40,41. (Use a comma to separate answers as needed. Use ascending order.)arrow_forwardWhat type of variable ( nominal or ordinal) is class?arrow_forward
- Find class boundaries, midpoint, and width for the class.. 130-156 Part: 0/3 Part 1 of 3 The class boundaries for the class are Skip Part Checkarrow_forward= Homework: 2.3 HW Let A = {4,5,7} and B {8,9}. Find A x B. Choose the correct set. O A. (32,36,40,45,56,63} O B. {(4,8),(4,9),(5,8),(5,9),(7,8),(7,9),(8,4),(8,5),(8,7),(9,4),(9,5),(9,7)} O C. {(4,8).(4,9),(5,8),(5,9),(7,8),(7,9)} O D. {(8,4),(8,5),(8,7),(9,4),(9,5),(9,7)}arrow_forwardHere are the numbers of times 9 people ate out last month. 5 , 6 , 4 , 5 , 6 , 5 , 7 , 7 , 7 Send data to calculator Find the modes of this data set. If there is more than one mode, write them separated by commas.If there is no mode, click on "No mode."arrow_forward
- Count the number of vertices, edges, and facesarrow_forwardDaily High Temp. The histograms describe the high temperatures in a certain city on each day of one month. The histogram on the left uses class widths of 3°F and the histogram on the right uses class widths of 6°F. Assume that temperature is measured and recorded as whole number values so that the first class would be 64°F-66°F when using a class width of 3°F. Complete parts (a) through (c) below. Daily High Temp. 64 70 76 82 88 94 Degrees Farenheit 64 70 76 82 88 94 Degrees Fareniheit a. During this month, there tends to be two types of weather. The city experiences either cool, foggy days or hot, sunny days. Which of the two histograms better reflects this? O A. The histogram with class widths of 6°F, because the histogram has larger class widths. O B. The histogram with class widths of 6°F, because there are no gaps in the histogram. OC. The histogram with class widths of 3°F, because the two distinct groups of data are separated by a gap in the histogram. O D. The histogram with…arrow_forwardDetermine the original set of data. 1016 2 1 447 9 3 3 5 5 5 7 8 401 Legend: 110 represents 10 The original set of data is 16 (Use a comma to separate answers as needed. Use ascending order.)arrow_forward
arrow_back_ios
arrow_forward_ios
Recommended textbooks for you
- MATLAB: An Introduction with ApplicationsStatisticsISBN:9781119256830Author:Amos GilatPublisher:John Wiley & Sons Inc
 Probability and Statistics for Engineering and th...StatisticsISBN:9781305251809Author:Jay L. DevorePublisher:Cengage Learning
 Statistics for The Behavioral Sciences (MindTap C...StatisticsISBN:9781305504912Author:Frederick J Gravetter, Larry B. WallnauPublisher:Cengage Learning
  Elementary Statistics: Picturing the World (7th E...StatisticsISBN:9780134683416Author:Ron Larson, Betsy FarberPublisher:PEARSON
 The Basic Practice of StatisticsStatisticsISBN:9781319042578Author:David S. Moore, William I. Notz, Michael A. FlignerPublisher:W. H. Freeman
 Introduction to the Practice of StatisticsStatisticsISBN:9781319013387Author:David S. Moore, George P. McCabe, Bruce A. CraigPublisher:W. H. Freeman
MATLAB: An Introduction with Applications
Statistics
ISBN:9781119256830
Author:Amos Gilat
Publisher:John Wiley & Sons Inc
Probability and Statistics for Engineering and th...
Statistics
ISBN:9781305251809
Author:Jay L. Devore
Publisher:Cengage Learning
Statistics for The Behavioral Sciences (MindTap C...
Statistics
ISBN:9781305504912
Author:Frederick J Gravetter, Larry B. Wallnau
Publisher:Cengage Learning
Elementary Statistics: Picturing the World (7th E...
Statistics
ISBN:9780134683416
Author:Ron Larson, Betsy Farber
Publisher:PEARSON
The Basic Practice of Statistics
Statistics
ISBN:9781319042578
Author:David S. Moore, William I. Notz, Michael A. Fligner
Publisher:W. H. Freeman
Introduction to the Practice of Statistics
Statistics
ISBN:9781319013387
Author:David S. Moore, George P. McCabe, Bruce A. Craig
Publisher:W. H. Freeman