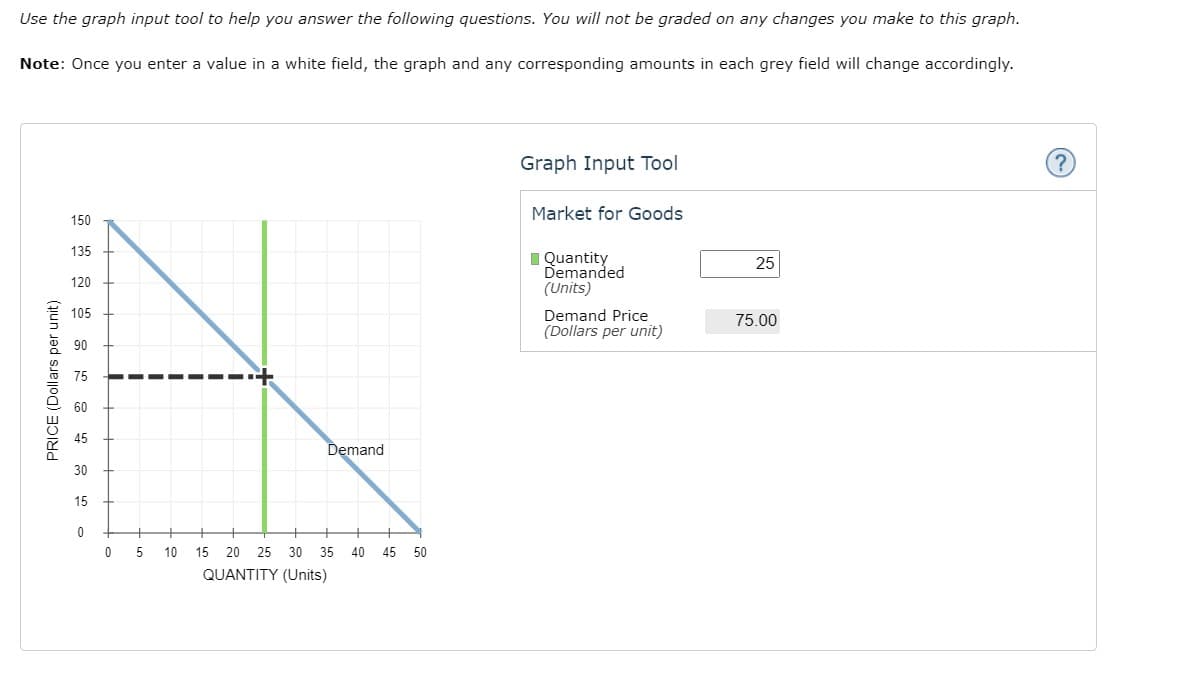
Use the graph input tool to help you answer the following questions. You will not be graded on any changes you make to this graph. Note: Once you enter a value in a white field, the graph and any corresponding amounts in each grey field will change accordingly. Graph Input Tool Market for Goods 150 135 I Quantity Demanded (Units) 25 120 105 Demand Price (Dollars per unit) 75.00 90 75 45 Demand 30 15 10 15 20 25 30 35 40 45 50 QUANTITY (Units) PRICE (Dollars per unit)
Use the graph input tool to help you answer the following questions. You will not be graded on any changes you make to this graph. Note: Once you enter a value in a white field, the graph and any corresponding amounts in each grey field will change accordingly. Graph Input Tool Market for Goods 150 135 I Quantity Demanded (Units) 25 120 105 Demand Price (Dollars per unit) 75.00 90 75 45 Demand 30 15 10 15 20 25 30 35 40 45 50 QUANTITY (Units) PRICE (Dollars per unit)

Chapter1: Introducing The Economic Way Of Thinking
Section1.A: Applying Graphs To Economics
Problem 2SQP

Related questions
Question
100%
Transcribed Image Text:Use the graph input tool to help you answer the following questions. You will not be graded on any changes you make to this graph.
Note: Once you enter a value in a white field, the graph and any corresponding amounts in each grey field will change accordingly.
Graph Input Tool
Market for Goods
150
135
I Quantity
Demanded
(Units)
25
120
105
Demand Price
(Dollars per unit)
75.00
Demand
30
15
5
10
15 20 25 30 35
40
45
50
QUANTITY (Units)
PRICE (Dollars per unit)
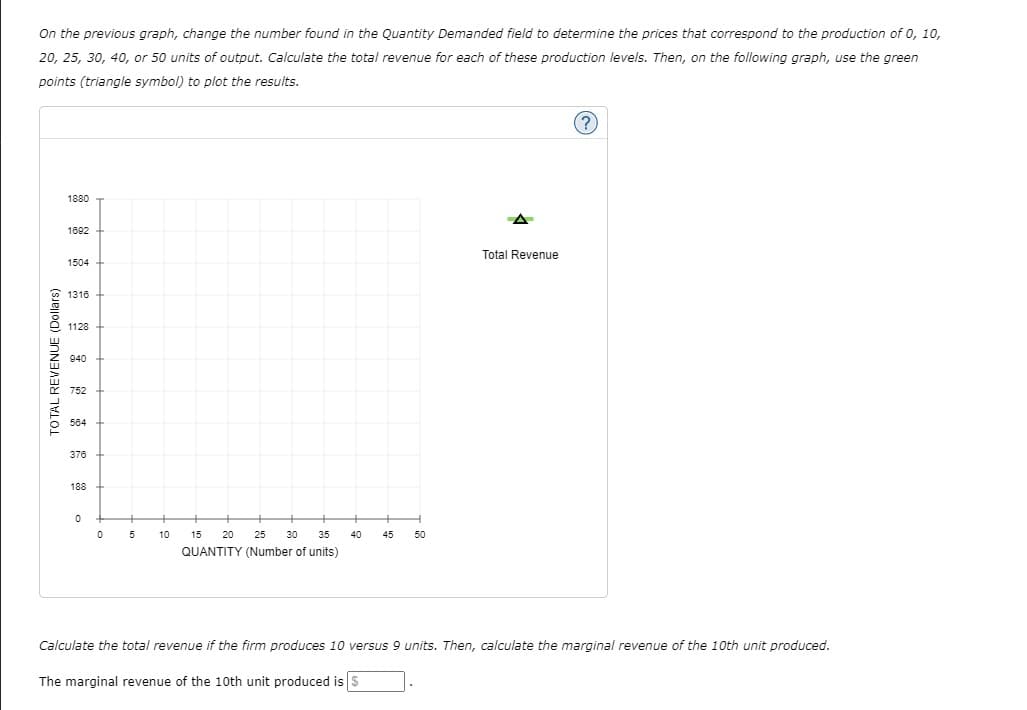
Transcribed Image Text:On the previous graph, change the number found in the Quantity Demanded field to determine the prices that correspond to the production of 0, 10,
20, 25, 30, 40, or 50 units of output. Calculate the total revenue for each of these production levels. Then, on the following graph, use the green
points (triangle symbol) to plot the results.
1880
1692
Total Revenue
1504
1316
1128
940
752
584
376
188
10
15
20
25
30
35
40
45
50
QUANTITY (Number of units)
Calculate the total revenue if the firm produces 10 versus 9 units. Then, calculate the marginal revenue of the 10th unit produced.
The marginal revenue of the 10th unit produced is S
TO TAL REVENUE (Dollars)
Expert Solution
This question has been solved!
Explore an expertly crafted, step-by-step solution for a thorough understanding of key concepts.

This is a popular solution!

Trending now
This is a popular solution!

Step by step
Solved in 3 steps with 2 images

Knowledge Booster


Learn more about
Need a deep-dive on the concept behind this application? Look no further. Learn more about this topic, economics and related others by exploring similar questions and additional content below.Recommended textbooks for you


