Using Linear Regression: Background: Atlantic hurricanes form off the western coast of Africa. As warm moist air rises, it begins to rotate around a low-pressure system. This rotation is sustained by warm ocean temperatures and a central low pressure. Once a sustained wind speed of 74 miles per hour is reached, the storm is considered a hurricane. As man-made climate change continues to increase the temperature of the Earth’s oceans, it is expected that the strength of hurricanes will increase. Note: Use equation provided by the graph 1. How much of the variation in the dependent variable can be explained by the independent variable using the linear regression equation? 2. What is the correlation coefficient of the relationship? (Round to three decimal places) 3. What is the expected maximum sustained wind speed (in knots) of a hurricane that maintains a central pressure of 930mb? 4. Suppose a maximum sustained wind speed of 140kts was measured during an Atlantic landfalling hurricane. What is the expected central pressure driving this wind speed?


Using Linear Regression:
Background: Atlantic hurricanes form off the western coast of Africa. As warm moist air rises, it begins to rotate around a low-pressure system. This rotation is sustained by warm ocean temperatures and a central low pressure. Once a sustained wind speed of 74 miles per hour is reached, the storm is considered a hurricane. As man-made climate change continues to increase the temperature of the Earth’s oceans, it is expected that the strength of hurricanes will increase.
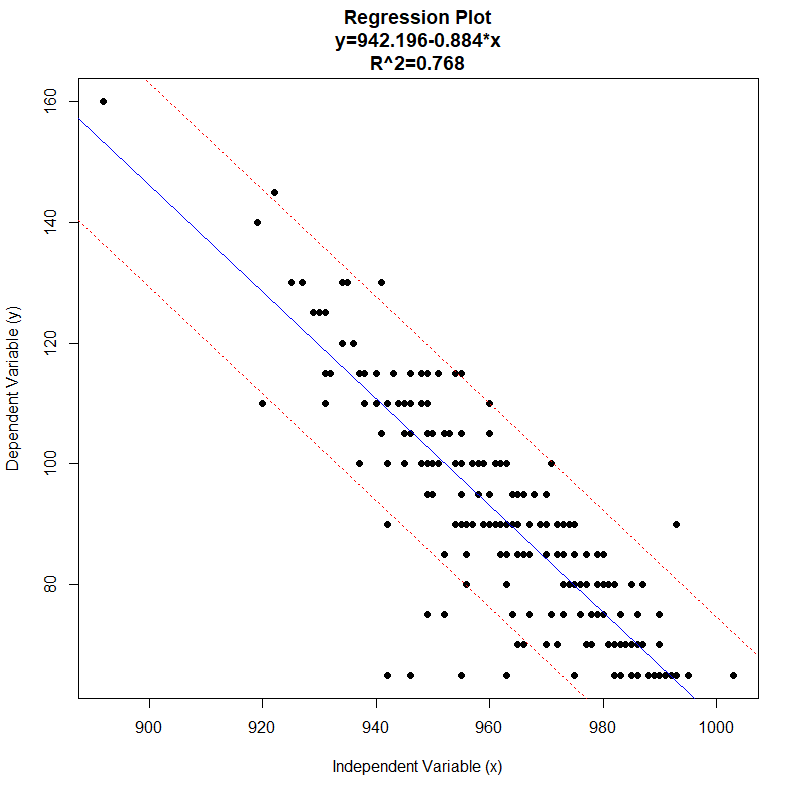
Note: Use equation provided by the graph
1. How much of the variation in the dependent variable can be explained by the independent variable using the linear regression equation?
2. What is the
(Round to three decimal places)
3. What is the expected maximum sustained wind speed (in knots) of a hurricane that maintains a central pressure of 930mb?
4. Suppose a maximum sustained wind speed of 140kts was measured during an Atlantic landfalling hurricane. What is the expected central pressure driving this wind speed?


Trending now
This is a popular solution!

Step by step
Solved in 3 steps

